

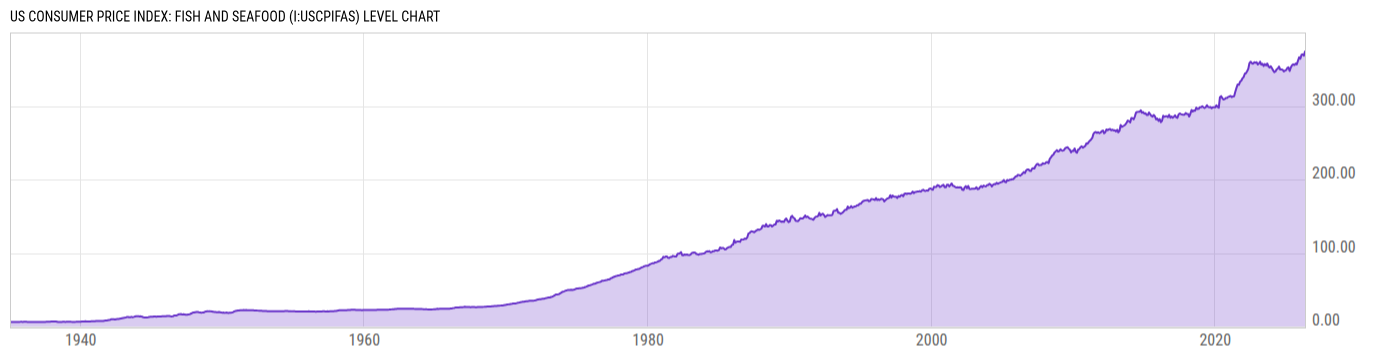
US Consumer Price Index: Fish And Seafood (I:USCPIFAS)
374.20 for Apr 2026
Level Chart
Basic Info
|
US Consumer Price Index: Fish And Seafood is at a current level of 374.20, up from 368.51 last month and up from 352.31 one year ago. This is a change of 1.54% from last month and 6.21% from one year ago. |
| Report | Consumer Price Index |
| Category | Consumer Prices |
| Region | United States |
| Source | Bureau of Labor Statistics |
Stats
| Last Value | 374.20 |
| Latest Period | Apr 2026 |
| Last Updated | May 13 2026, 11:13 EDT |
| Next Release | Jun 10 2026, 08:30 EDT |
| Average Growth Rate | 4.58% |
| Value from Last Month | 368.51 |
| Change from Last Month | 1.54% |
| Value from 1 Year Ago | 352.31 |
| Change from 1 Year Ago | 6.21% |
| Frequency | Monthly |
| Unit | Index 1982-84=100 |
| Adjustment | Not Seasonally Adjusted |
| Download Source File |
Historical Data
| Date | Value |
|---|---|
| April 30, 2026 | 374.20 |
| March 31, 2026 | 368.51 |
| February 28, 2026 | 370.31 |
| January 31, 2026 | 369.70 |
| December 31, 2025 | 364.20 |
| November 30, 2025 | 366.35 |
| October 31, 2025 | |
| September 30, 2025 | 356.66 |
| August 31, 2025 | 357.75 |
| July 31, 2025 | 355.72 |
| June 30, 2025 | 356.66 |
| May 31, 2025 | 355.43 |
| April 30, 2025 | 352.31 |
| March 31, 2025 | 347.68 |
| February 28, 2025 | 352.50 |
| January 31, 2025 | 351.72 |
| December 31, 2024 | 348.83 |
| November 30, 2024 | 348.17 |
| October 31, 2024 | 347.01 |
| September 30, 2024 | 349.34 |
| August 31, 2024 | 349.63 |
| July 31, 2024 | 349.66 |
| June 30, 2024 | 353.56 |
| May 31, 2024 | 351.07 |
| April 30, 2024 | 349.92 |
| Date | Value |
|---|---|
| March 31, 2024 | 347.08 |
| February 29, 2024 | 346.12 |
| January 31, 2024 | 348.42 |
| December 31, 2023 | 351.30 |
| November 30, 2023 | 354.15 |
| October 31, 2023 | 352.38 |
| September 30, 2023 | 354.08 |
| August 31, 2023 | 357.85 |
| July 31, 2023 | 355.24 |
| June 30, 2023 | 357.04 |
| May 31, 2023 | 354.52 |
| April 30, 2023 | 357.39 |
| March 31, 2023 | 356.28 |
| February 28, 2023 | 360.25 |
| January 31, 2023 | 357.72 |
| December 31, 2022 | 356.45 |
| November 30, 2022 | 359.51 |
| October 31, 2022 | 358.91 |
| September 30, 2022 | 359.50 |
| August 31, 2022 | 357.56 |
| July 31, 2022 | 358.19 |
| June 30, 2022 | 360.24 |
| May 31, 2022 | 358.45 |
| April 30, 2022 | 350.49 |
| March 31, 2022 | 347.22 |
News
Headline
Time (ET)
05/14 06:14
04/21 12:24
04/20 11:18
Basic Info
|
US Consumer Price Index: Fish And Seafood is at a current level of 374.20, up from 368.51 last month and up from 352.31 one year ago. This is a change of 1.54% from last month and 6.21% from one year ago. |
| Report | Consumer Price Index |
| Category | Consumer Prices |
| Region | United States |
| Source | Bureau of Labor Statistics |
Stats
| Last Value | 374.20 |
| Latest Period | Apr 2026 |
| Last Updated | May 13 2026, 11:13 EDT |
| Next Release | Jun 10 2026, 08:30 EDT |
| Average Growth Rate | 4.58% |
| Value from Last Month | 368.51 |
| Change from Last Month | 1.54% |
| Value from 1 Year Ago | 352.31 |
| Change from 1 Year Ago | 6.21% |
| Frequency | Monthly |
| Unit | Index 1982-84=100 |
| Adjustment | Not Seasonally Adjusted |
| Download Source File |