

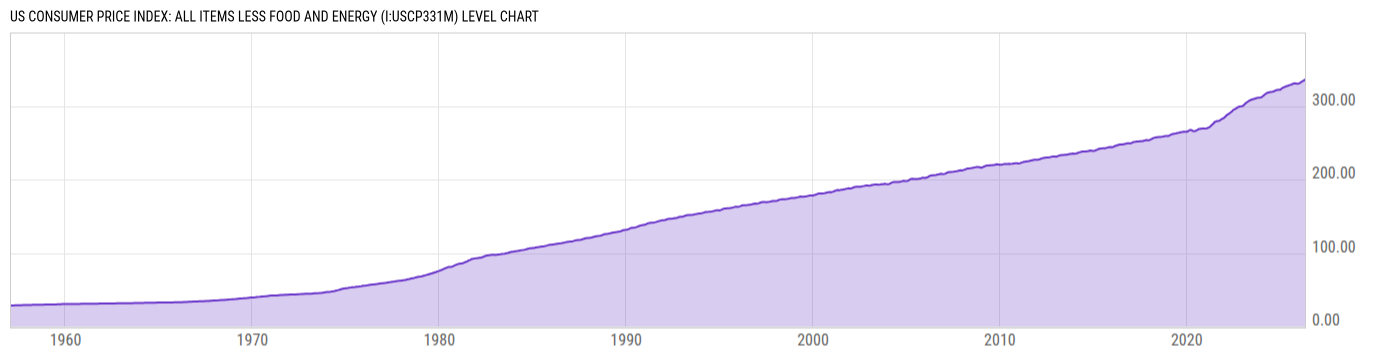
US Consumer Price Index: All Items Less Food and Energy (I:USCP331M)
335.80 for Apr 2026
Level Chart
Basic Info
|
US Consumer Price Index: All Items Less Food and Energy is at a current level of 335.80, up from 334.39 last month and up from 326.82 one year ago. This is a change of 0.42% from last month and 2.75% from one year ago. |
| Report | Consumer Price Index |
| Category | Consumer Prices |
| Region | United States |
| Source | Bureau of Labor Statistics |
Stats
| Last Value | 335.80 |
| Latest Period | Apr 2026 |
| Last Updated | May 12 2026, 08:36 EDT |
| Next Release | Jun 10 2026, 08:30 EDT |
| Average Growth Rate | 3.58% |
| Value from Last Month | 334.39 |
| Change from Last Month | 0.42% |
| Value from 1 Year Ago | 326.82 |
| Change from 1 Year Ago | 2.75% |
| Frequency | Monthly |
| Unit | Index 1982-84=100 |
| Adjustment | Not Seasonally Adjusted |
| Download Source File | |
| Notes | All urban consumers, less food and energy. |
Historical Data
| Date | Value |
|---|---|
| April 30, 2026 | 335.80 |
| March 31, 2026 | 334.39 |
| February 28, 2026 | 333.24 |
| January 31, 2026 | 331.95 |
| December 31, 2025 | 330.51 |
| November 30, 2025 | 330.42 |
| October 31, 2025 | |
| September 30, 2025 | 330.80 |
| August 31, 2025 | 329.97 |
| July 31, 2025 | 328.98 |
| June 30, 2025 | 328.36 |
| May 31, 2025 | 327.51 |
| April 30, 2025 | 326.82 |
| March 31, 2025 | 325.93 |
| February 28, 2025 | 325.25 |
| January 31, 2025 | 323.84 |
| December 31, 2024 | 322.01 |
| November 30, 2024 | 321.95 |
| October 31, 2024 | 321.76 |
| September 30, 2024 | 321.11 |
| August 31, 2024 | 320.02 |
| July 31, 2024 | 319.21 |
| June 30, 2024 | 319.00 |
| May 31, 2024 | 318.63 |
| April 30, 2024 | 317.98 |
| Date | Value |
|---|---|
| March 31, 2024 | 317.09 |
| February 29, 2024 | 315.42 |
| January 31, 2024 | 313.62 |
| December 31, 2023 | 311.91 |
| November 30, 2023 | 311.61 |
| October 31, 2023 | 311.38 |
| September 30, 2023 | 310.82 |
| August 31, 2023 | 310.10 |
| July 31, 2023 | 309.40 |
| June 30, 2023 | 308.91 |
| May 31, 2023 | 308.10 |
| April 30, 2023 | 306.90 |
| March 31, 2023 | 305.48 |
| February 28, 2023 | 304.01 |
| January 31, 2023 | 301.96 |
| December 31, 2022 | 300.11 |
| November 30, 2022 | 299.60 |
| October 31, 2022 | 299.32 |
| September 30, 2022 | 298.44 |
| August 31, 2022 | 297.18 |
| July 31, 2022 | 295.65 |
| June 30, 2022 | 294.68 |
| May 31, 2022 | 292.51 |
| April 30, 2022 | 290.85 |
| March 31, 2022 | 289.30 |
News
Headline
Time (ET)
05/22 09:11
05/14 06:14
Basic Info
|
US Consumer Price Index: All Items Less Food and Energy is at a current level of 335.80, up from 334.39 last month and up from 326.82 one year ago. This is a change of 0.42% from last month and 2.75% from one year ago. |
| Report | Consumer Price Index |
| Category | Consumer Prices |
| Region | United States |
| Source | Bureau of Labor Statistics |
Stats
| Last Value | 335.80 |
| Latest Period | Apr 2026 |
| Last Updated | May 12 2026, 08:36 EDT |
| Next Release | Jun 10 2026, 08:30 EDT |
| Average Growth Rate | 3.58% |
| Value from Last Month | 334.39 |
| Change from Last Month | 0.42% |
| Value from 1 Year Ago | 326.82 |
| Change from 1 Year Ago | 2.75% |
| Frequency | Monthly |
| Unit | Index 1982-84=100 |
| Adjustment | Not Seasonally Adjusted |
| Download Source File | |
| Notes | All urban consumers, less food and energy. |