

US Consumer Price Index: All Items Less Food and Energy MoM (I:USCPIASMP)
0.40% for Apr 2026
Level Chart
Basic Info
|
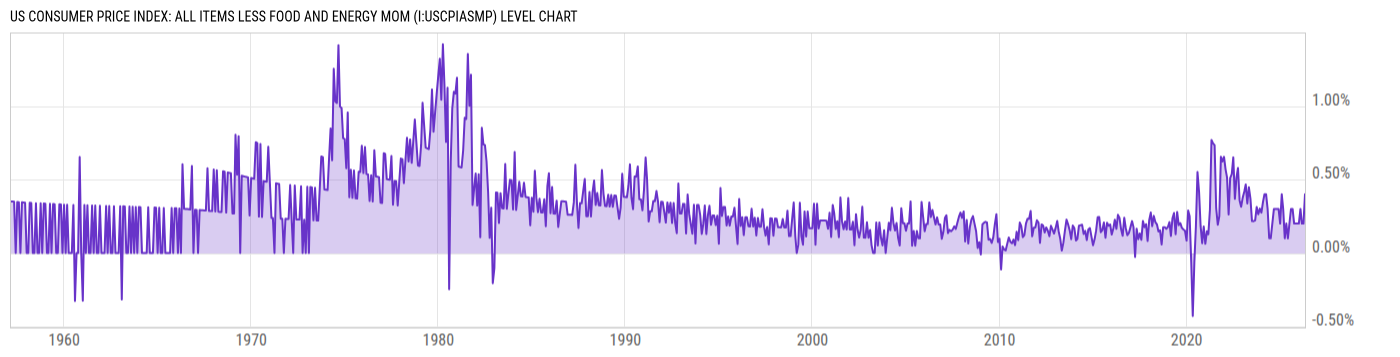
US Consumer Price Index: All Items Less Food and Energy MoM is at 0.40%, compared to 0.20% last month and 0.20% last year. This is higher than the long term average of 0.30%. |
| Report | Consumer Price Index |
| Category | Consumer Prices |
| Region | United States |
| Source | Bureau of Labor Statistics |
Stats
| Last Value | 0.40% |
| Latest Period | Apr 2026 |
| Last Updated | May 12 2026, 08:36 EDT |
| Next Release | Jun 10 2026, 08:30 EDT |
| Long Term Average | 0.30% |
| Average Growth Rate | 37.39% |
| Value from Last Month | 0.20% |
| Change from Last Month | 100.0% |
| Value from 1 Year Ago | 0.20% |
| Change from 1 Year Ago | 100.0% |
| Frequency | Monthly |
| Unit | Percent Index 1982-84=100 |
| Adjustment | Seasonally Adjusted |
| Download Source File | |
| Notes | All urban consumers, less food and energy. |
Historical Data
| Date | Value |
|---|---|
| April 30, 2026 | 0.40% |
| March 31, 2026 | 0.20% |
| February 28, 2026 | 0.20% |
| January 31, 2026 | 0.30% |
| December 31, 2025 | 0.20% |
| November 30, 2025 | |
| October 31, 2025 | |
| September 30, 2025 | 0.20% |
| August 31, 2025 | 0.30% |
| July 31, 2025 | 0.30% |
| June 30, 2025 | 0.20% |
| May 31, 2025 | 0.10% |
| April 30, 2025 | 0.20% |
| March 31, 2025 | 0.10% |
| February 28, 2025 | 0.30% |
| January 31, 2025 | 0.40% |
| December 31, 2024 | 0.20% |
| November 30, 2024 | 0.30% |
| October 31, 2024 | 0.30% |
| September 30, 2024 | 0.30% |
| August 31, 2024 | 0.30% |
| July 31, 2024 | 0.20% |
| June 30, 2024 | 0.10% |
| May 31, 2024 | 0.10% |
| April 30, 2024 | 0.30% |
| Date | Value |
|---|---|
| March 31, 2024 | 0.40% |
| February 29, 2024 | 0.40% |
| January 31, 2024 | 0.35% |
| December 31, 2023 | 0.27% |
| November 30, 2023 | 0.30% |
| October 31, 2023 | 0.26% |
| September 30, 2023 | 0.31% |
| August 31, 2023 | 0.22% |
| July 31, 2023 | 0.22% |
| June 30, 2023 | 0.22% |
| May 31, 2023 | 0.37% |
| April 30, 2023 | 0.45% |
| March 31, 2023 | 0.34% |
| February 28, 2023 | 0.47% |
| January 31, 2023 | 0.42% |
| December 31, 2022 | 0.38% |
| November 30, 2022 | 0.31% |
| October 31, 2022 | 0.36% |
| September 30, 2022 | 0.58% |
| August 31, 2022 | 0.51% |
| July 31, 2022 | 0.37% |
| June 30, 2022 | 0.65% |
| May 31, 2022 | 0.54% |
| April 30, 2022 | 0.51% |
| March 31, 2022 | 0.26% |
News
Headline
Time (ET)
05/22 09:11
05/14 06:14
Basic Info
|
US Consumer Price Index: All Items Less Food and Energy MoM is at 0.40%, compared to 0.20% last month and 0.20% last year. This is higher than the long term average of 0.30%. |
| Report | Consumer Price Index |
| Category | Consumer Prices |
| Region | United States |
| Source | Bureau of Labor Statistics |
Stats
| Last Value | 0.40% |
| Latest Period | Apr 2026 |
| Last Updated | May 12 2026, 08:36 EDT |
| Next Release | Jun 10 2026, 08:30 EDT |
| Long Term Average | 0.30% |
| Average Growth Rate | 37.39% |
| Value from Last Month | 0.20% |
| Change from Last Month | 100.0% |
| Value from 1 Year Ago | 0.20% |
| Change from 1 Year Ago | 100.0% |
| Frequency | Monthly |
| Unit | Percent Index 1982-84=100 |
| Adjustment | Seasonally Adjusted |
| Download Source File | |
| Notes | All urban consumers, less food and energy. |