

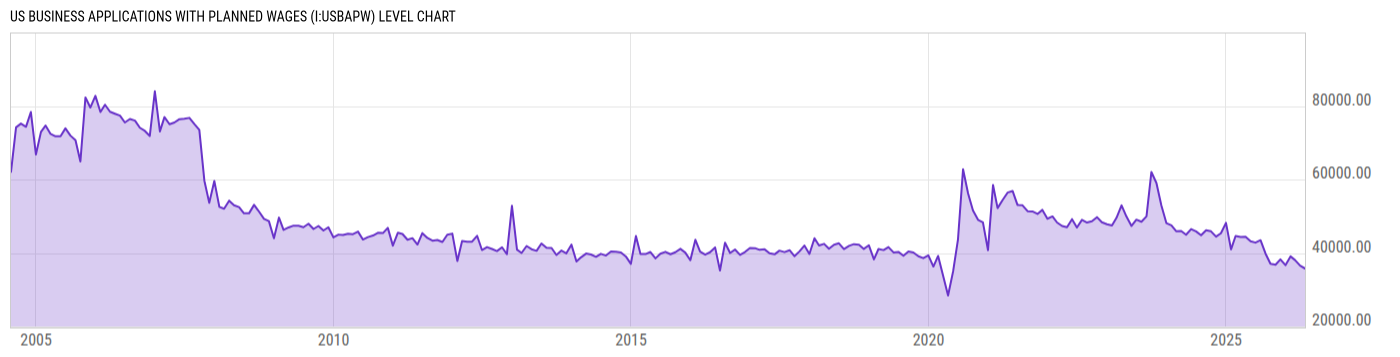
US Business Applications with Planned Wages (I:USBAPW)
35775.00 for Apr 2026
Level Chart
Basic Info
|
US Business Applications with Planned Wages is at a current level of 35775.00, down from 36552.00 last month and down from 44390.00 one year ago. This is a change of -2.13% from last month and -19.41% from one year ago. |
| Region | United States |
| Source | Census Bureau |
Stats
| Last Value | 35775.00 |
| Latest Period | Apr 2026 |
| Last Updated | May 13 2026, 10:05 EDT |
| Next Release | Jun 10 2026, 10:00 EDT |
| Average Growth Rate | 0.91% |
| Value from Last Month | 36552.00 |
| Change from Last Month | -2.13% |
| Value from 1 Year Ago | 44390.00 |
| Change from 1 Year Ago | -19.41% |
| Frequency | Monthly |
| Adjustment | Seasonally Adjusted |
Historical Data
| Date | Value |
|---|---|
| April 30, 2026 | 35775.00 |
| March 31, 2026 | 36552.00 |
| February 28, 2026 | 38068.00 |
| January 31, 2026 | 39077.00 |
| December 31, 2025 | 36691.00 |
| November 30, 2025 | 38257.00 |
| October 31, 2025 | 36810.00 |
| September 30, 2025 | 37073.00 |
| August 31, 2025 | 39804.00 |
| July 31, 2025 | 43479.00 |
| June 30, 2025 | 42820.00 |
| May 31, 2025 | 43185.00 |
| April 30, 2025 | 44390.00 |
| March 31, 2025 | 44333.00 |
| February 28, 2025 | 44613.00 |
| January 31, 2025 | 40982.00 |
| December 31, 2024 | 48204.00 |
| November 30, 2024 | 45373.00 |
| October 31, 2024 | 44439.00 |
| September 30, 2024 | 45895.00 |
| August 31, 2024 | 46183.00 |
| July 31, 2024 | 44808.00 |
| June 30, 2024 | 45881.00 |
| May 31, 2024 | 46510.00 |
| April 30, 2024 | 44966.00 |
| Date | Value |
|---|---|
| March 31, 2024 | 45988.00 |
| February 29, 2024 | 45952.00 |
| January 31, 2024 | 47503.00 |
| December 31, 2023 | 48147.00 |
| November 30, 2023 | 52977.00 |
| October 31, 2023 | 59042.00 |
| September 30, 2023 | 62033.00 |
| August 31, 2023 | 49960.00 |
| July 31, 2023 | 48498.00 |
| June 30, 2023 | 49074.00 |
| May 31, 2023 | 47357.00 |
| April 30, 2023 | 49917.00 |
| March 31, 2023 | 52964.00 |
| February 28, 2023 | 49572.00 |
| January 31, 2023 | 47496.00 |
| December 31, 2022 | 47825.00 |
| November 30, 2022 | 48366.00 |
| October 31, 2022 | 49750.00 |
| September 30, 2022 | 48651.00 |
| August 31, 2022 | 48278.00 |
| July 31, 2022 | 49024.00 |
| June 30, 2022 | 46935.00 |
| May 31, 2022 | 49205.00 |
| April 30, 2022 | 46994.00 |
| March 31, 2022 | 47351.00 |
News
Headline
Time (ET)
05/21 07:19
04/23 08:36
Basic Info
|
US Business Applications with Planned Wages is at a current level of 35775.00, down from 36552.00 last month and down from 44390.00 one year ago. This is a change of -2.13% from last month and -19.41% from one year ago. |
| Region | United States |
| Source | Census Bureau |
Stats
| Last Value | 35775.00 |
| Latest Period | Apr 2026 |
| Last Updated | May 13 2026, 10:05 EDT |
| Next Release | Jun 10 2026, 10:00 EDT |
| Average Growth Rate | 0.91% |
| Value from Last Month | 36552.00 |
| Change from Last Month | -2.13% |
| Value from 1 Year Ago | 44390.00 |
| Change from 1 Year Ago | -19.41% |
| Frequency | Monthly |
| Adjustment | Seasonally Adjusted |