

Timber Price Index (I:TPINM)
81.50 for Jun 2026
Level Chart
Basic Info
|
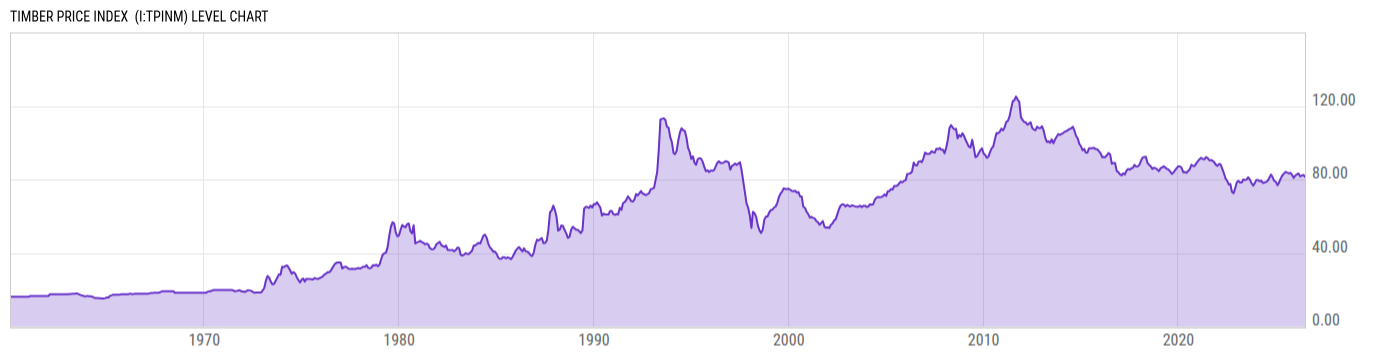
Timber Price Index is at a current level of 81.50, down from 82.50 last month and down from 84.20 one year ago. This is a change of -1.21% from last month and -3.21% from one year ago. |
| Report | Commodity Markets Review |
| Categories | Agriculture and Livestock , Chemicals , Metals |
| Region | N/A |
| Source | World Bank |
Stats
| Last Value | 81.50 |
| Latest Period | Jun 2026 |
| Last Updated | Jul 6 2026, 11:00 EDT |
| Next Release | Aug 5 2026, 11:00 EDT (E) |
| Average Growth Rate | 3.05% |
| Value from Last Month | 82.50 |
| Change from Last Month | -1.21% |
| Value from 1 Year Ago | 84.20 |
| Change from 1 Year Ago | -3.21% |
| Frequency | Monthly |
| Unit | Index 2010=100 |
| Adjustment | N/A |
| Download Source File | |
| Notes | Weighted average of log and sawnwood prices. Based on current US dollars, 2010=100. |
Historical Data
| Date | Value |
|---|---|
| June 30, 2026 | 81.50 |
| May 31, 2026 | 82.50 |
| April 30, 2026 | 82.10 |
| March 31, 2026 | 81.70 |
| February 28, 2026 | 83.30 |
| January 31, 2026 | 82.80 |
| December 31, 2025 | 82.20 |
| November 30, 2025 | 80.90 |
| October 31, 2025 | 82.50 |
| September 30, 2025 | 83.60 |
| August 31, 2025 | 83.30 |
| July 31, 2025 | 83.70 |
| June 30, 2025 | 84.20 |
| May 31, 2025 | 83.20 |
| April 30, 2025 | 82.20 |
| March 31, 2025 | 80.50 |
| February 28, 2025 | 78.30 |
| January 31, 2025 | 76.90 |
| December 31, 2024 | 78.70 |
| November 30, 2024 | 79.20 |
| October 31, 2024 | 81.20 |
| September 30, 2024 | 82.70 |
| August 31, 2024 | 80.90 |
| July 31, 2024 | 79.30 |
| June 30, 2024 | 78.60 |
| Date | Value |
|---|---|
| May 31, 2024 | 78.39 |
| April 30, 2024 | 78.09 |
| March 31, 2024 | 79.41 |
| February 29, 2024 | 79.04 |
| January 31, 2024 | 79.76 |
| December 31, 2023 | 79.79 |
| November 30, 2023 | 77.92 |
| October 31, 2023 | 76.69 |
| September 30, 2023 | 78.09 |
| August 31, 2023 | 79.92 |
| July 31, 2023 | 81.25 |
| June 30, 2023 | 79.93 |
| May 31, 2023 | 79.74 |
| April 30, 2023 | 80.02 |
| March 31, 2023 | 78.42 |
| February 28, 2023 | 78.33 |
| January 31, 2023 | 79.26 |
| December 31, 2022 | 78.48 |
| November 30, 2022 | 75.37 |
| October 31, 2022 | 72.53 |
| September 30, 2022 | 73.26 |
| August 31, 2022 | 77.50 |
| July 31, 2022 | 77.32 |
| June 30, 2022 | 79.36 |
| May 31, 2022 | 80.70 |
News
Headline
Time (ET)
07/15 06:12
07/14 08:48
06/19 07:05
06/18 06:42
06/17 06:40
Basic Info
|
Timber Price Index is at a current level of 81.50, down from 82.50 last month and down from 84.20 one year ago. This is a change of -1.21% from last month and -3.21% from one year ago. |
| Report | Commodity Markets Review |
| Categories | Agriculture and Livestock , Chemicals , Metals |
| Region | N/A |
| Source | World Bank |
Stats
| Last Value | 81.50 |
| Latest Period | Jun 2026 |
| Last Updated | Jul 6 2026, 11:00 EDT |
| Next Release | Aug 5 2026, 11:00 EDT (E) |
| Average Growth Rate | 3.05% |
| Value from Last Month | 82.50 |
| Change from Last Month | -1.21% |
| Value from 1 Year Ago | 84.20 |
| Change from 1 Year Ago | -3.21% |
| Frequency | Monthly |
| Unit | Index 2010=100 |
| Adjustment | N/A |
| Download Source File | |
| Notes | Weighted average of log and sawnwood prices. Based on current US dollars, 2010=100. |