

Texas Retail Input Prices Index (DISCONTINUED) (I:TRIPISM)
38.50 for Dec 2025
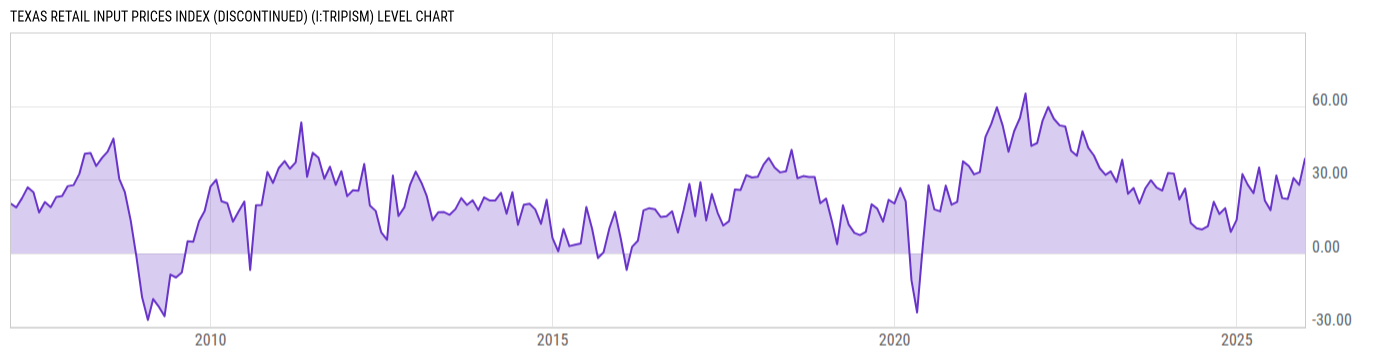
Level Chart
Basic Info
|
Texas Retail Input Prices Index is at a current level of 38.50, up from 27.80 last month and up from 13.50 one year ago. This is a change of 38.49% from last month and 185.2% from one year ago. |
| Report | Texas Retail Outlook Survey |
| Category | Retail and Services Business Statistics |
| Region | Texas |
| Source | Federal Reserve Bank of Dallas |
Stats
| Last Value | 38.50 |
| Latest Period | Dec 2025 |
| Last Updated | Dec 30 2025, 10:36 EST |
| Average Growth Rate | 396.7% |
| Value from Last Month | 27.80 |
| Change from Last Month | 38.49% |
| Value from 1 Year Ago | 13.50 |
| Change from 1 Year Ago | 185.2% |
| Frequency | Monthly |
| Adjustment | Seasonally Adjusted |
| Download Source File |
Historical Data
| Date | Value |
|---|---|
| December 31, 2025 | 38.50 |
| November 30, 2025 | 27.80 |
| October 31, 2025 | 30.60 |
| September 30, 2025 | 22.00 |
| August 31, 2025 | 22.40 |
| July 31, 2025 | 31.60 |
| June 30, 2025 | 17.50 |
| May 31, 2025 | 21.30 |
| April 30, 2025 | 34.90 |
| March 31, 2025 | 24.40 |
| February 28, 2025 | 27.90 |
| January 31, 2025 | 32.20 |
| December 31, 2024 | 13.50 |
| November 30, 2024 | 8.60 |
| October 31, 2024 | 18.30 |
| September 30, 2024 | 15.90 |
| August 31, 2024 | 20.90 |
| July 31, 2024 | 11.00 |
| June 30, 2024 | 9.60 |
| May 31, 2024 | 10.10 |
| April 30, 2024 | 12.20 |
| March 31, 2024 | 26.30 |
| February 29, 2024 | 21.80 |
| January 31, 2024 | 32.40 |
| December 31, 2023 | 32.70 |
| Date | Value |
|---|---|
| November 30, 2023 | 25.50 |
| October 31, 2023 | 26.70 |
| September 30, 2023 | 29.70 |
| August 31, 2023 | 26.30 |
| July 31, 2023 | 20.20 |
| June 30, 2023 | 26.50 |
| May 31, 2023 | 24.20 |
| April 30, 2023 | 38.10 |
| March 31, 2023 | 29.00 |
| February 28, 2023 | 33.30 |
| January 31, 2023 | 31.90 |
| December 31, 2022 | 34.60 |
| November 30, 2022 | 39.80 |
| October 31, 2022 | 42.90 |
| September 30, 2022 | 49.70 |
| August 31, 2022 | 39.70 |
| July 31, 2022 | 41.70 |
| June 30, 2022 | 51.60 |
| May 31, 2022 | 52.10 |
| April 30, 2022 | 54.80 |
| March 31, 2022 | 59.60 |
| February 28, 2022 | 53.80 |
| January 31, 2022 | 44.90 |
| December 31, 2021 | 43.70 |
| November 30, 2021 | 65.10 |
News
Headline
Time (ET)
05/15 13:45
04/24 12:20
04/23 08:36
Basic Info
|
Texas Retail Input Prices Index is at a current level of 38.50, up from 27.80 last month and up from 13.50 one year ago. This is a change of 38.49% from last month and 185.2% from one year ago. |
| Report | Texas Retail Outlook Survey |
| Category | Retail and Services Business Statistics |
| Region | Texas |
| Source | Federal Reserve Bank of Dallas |
Stats
| Last Value | 38.50 |
| Latest Period | Dec 2025 |
| Last Updated | Dec 30 2025, 10:36 EST |
| Average Growth Rate | 396.7% |
| Value from Last Month | 27.80 |
| Change from Last Month | 38.49% |
| Value from 1 Year Ago | 13.50 |
| Change from 1 Year Ago | 185.2% |
| Frequency | Monthly |
| Adjustment | Seasonally Adjusted |
| Download Source File |