

Texas Leading Index (I:TLI)
127.89 for Feb 2026
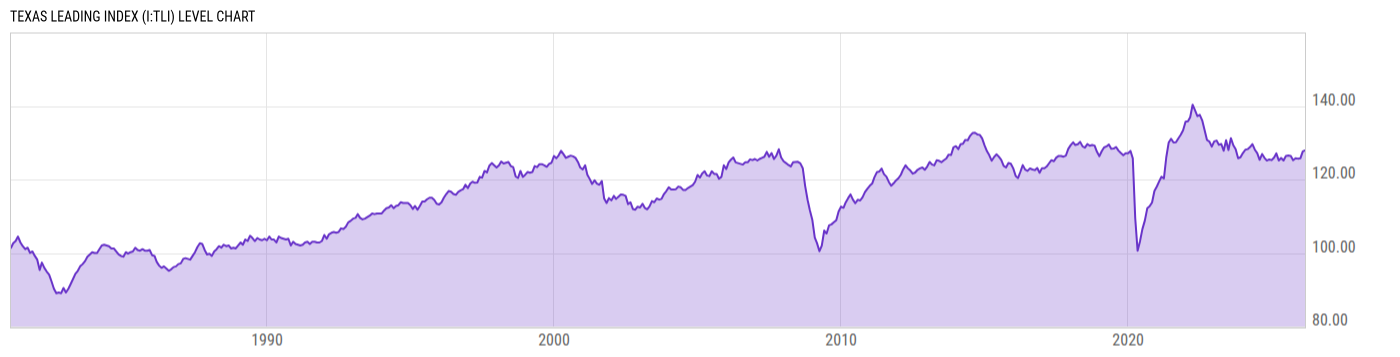
Level Chart
Basic Info
|
Texas Leading Index is at a current level of 127.89, up from 127.66 last month and up from 127.12 one year ago. This is a change of 0.18% from last month and 0.61% from one year ago. |
| Report | Texas Leading Index |
| Category | Economic Sentiment, Outlook and Activity |
| Region | Texas |
| Source | Federal Reserve Bank of Dallas |
Stats
| Last Value | 127.89 |
| Latest Period | Feb 2026 |
| Last Updated | May 1 2026, 10:02 EDT |
| Next Release | Jun 1 2026, 10:00 EDT (E) |
| Average Growth Rate | 0.60% |
| Value from Last Month | 127.66 |
| Change from Last Month | 0.18% |
| Value from 1 Year Ago | 127.12 |
| Change from 1 Year Ago | 0.61% |
| Frequency | Monthly |
| Unit | Index 1987=100 |
| Adjustment | N/A |
| Download Source File |
Historical Data
| Date | Value |
|---|---|
| February 28, 2026 | 127.89 |
| January 31, 2026 | 127.66 |
| December 31, 2025 | 125.76 |
| November 30, 2025 | 125.68 |
| October 31, 2025 | 125.77 |
| September 30, 2025 | 125.25 |
| August 31, 2025 | 126.38 |
| July 31, 2025 | 126.51 |
| June 30, 2025 | 126.37 |
| May 31, 2025 | 125.16 |
| April 30, 2025 | 125.86 |
| March 31, 2025 | 125.18 |
| February 28, 2025 | 127.12 |
| January 31, 2025 | 125.98 |
| December 31, 2024 | 125.27 |
| November 30, 2024 | 125.46 |
| October 31, 2024 | 125.14 |
| September 30, 2024 | 125.90 |
| August 31, 2024 | 126.93 |
| July 31, 2024 | 125.36 |
| June 30, 2024 | 127.19 |
| May 31, 2024 | 128.11 |
| April 30, 2024 | 129.61 |
| March 31, 2024 | 128.82 |
| February 29, 2024 | 128.26 |
| Date | Value |
|---|---|
| January 31, 2024 | 128.09 |
| December 31, 2023 | 127.20 |
| November 30, 2023 | 126.06 |
| October 31, 2023 | 125.78 |
| September 30, 2023 | 128.25 |
| August 31, 2023 | 129.32 |
| July 31, 2023 | 131.25 |
| June 30, 2023 | 128.01 |
| May 31, 2023 | 130.69 |
| April 30, 2023 | 127.81 |
| March 31, 2023 | 129.65 |
| February 28, 2023 | 129.47 |
| January 31, 2023 | 130.58 |
| December 31, 2022 | 130.36 |
| November 30, 2022 | 128.94 |
| October 31, 2022 | 130.29 |
| September 30, 2022 | 130.76 |
| August 31, 2022 | 133.43 |
| July 31, 2022 | 136.10 |
| June 30, 2022 | 137.59 |
| May 31, 2022 | 137.24 |
| April 30, 2022 | 138.87 |
| March 31, 2022 | 140.36 |
| February 28, 2022 | 136.95 |
| January 31, 2022 | 135.87 |
News
Headline
Time (ET)
04/29 12:54
Basic Info
|
Texas Leading Index is at a current level of 127.89, up from 127.66 last month and up from 127.12 one year ago. This is a change of 0.18% from last month and 0.61% from one year ago. |
| Report | Texas Leading Index |
| Category | Economic Sentiment, Outlook and Activity |
| Region | Texas |
| Source | Federal Reserve Bank of Dallas |
Stats
| Last Value | 127.89 |
| Latest Period | Feb 2026 |
| Last Updated | May 1 2026, 10:02 EDT |
| Next Release | Jun 1 2026, 10:00 EDT (E) |
| Average Growth Rate | 0.60% |
| Value from Last Month | 127.66 |
| Change from Last Month | 0.18% |
| Value from 1 Year Ago | 127.12 |
| Change from 1 Year Ago | 0.61% |
| Frequency | Monthly |
| Unit | Index 1987=100 |
| Adjustment | N/A |
| Download Source File |