

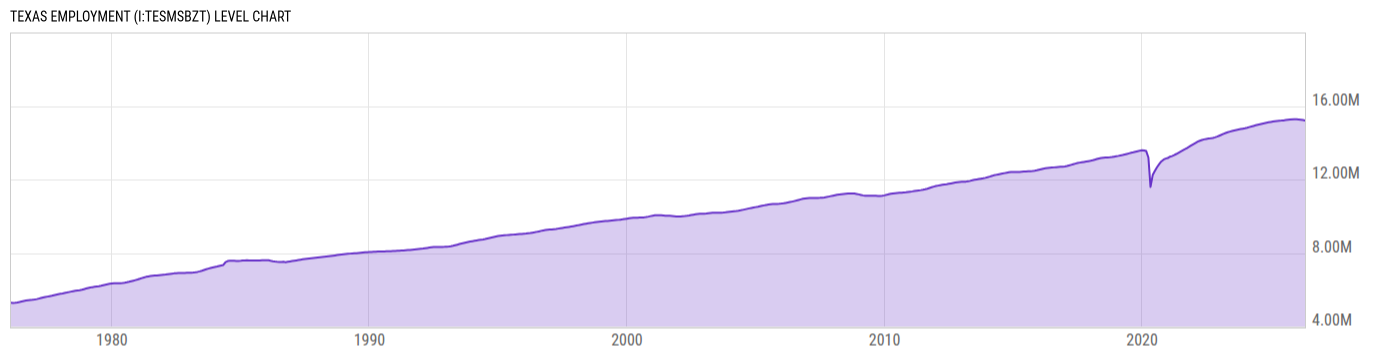
Texas Employment (I:TESMSBZT)
15.21M for Apr 2026
Level Chart
Basic Info
|
Texas Employment is at a current level of 15.21M, down from 15.24M last month and up from 15.20M one year ago. This is a change of -0.16% from last month and 0.09% from one year ago. |
| Report | Regional and State Employment and Unemployment |
| Categories | Employment , Hours and Wages |
| Region | Texas |
| Source | Bureau of Labor Statistics |
Stats
| Last Value | 15.21M |
| Latest Period | Apr 2026 |
| Last Updated | May 22 2026, 10:34 EDT |
| Next Release | Jun 23 2026, 10:30 EDT |
| Average Growth Rate | 2.13% |
| Value from Last Month | 15.24M |
| Change from Last Month | -0.16% |
| Value from 1 Year Ago | 15.20M |
| Change from 1 Year Ago | 0.09% |
| Frequency | Monthly |
| Adjustment | Seasonally Adjusted |
| Download Source File |
Historical Data
| Date | Value |
|---|---|
| April 30, 2026 | 15.21M |
| March 31, 2026 | 15.24M |
| February 28, 2026 | 15.26M |
| January 31, 2026 | 15.27M |
| December 31, 2025 | 15.27M |
| November 30, 2025 | 15.28M |
| October 31, 2025 | |
| September 30, 2025 | 15.26M |
| August 31, 2025 | 15.25M |
| July 31, 2025 | 15.23M |
| June 30, 2025 | 15.22M |
| May 31, 2025 | 15.21M |
| April 30, 2025 | 15.20M |
| March 31, 2025 | 15.19M |
| February 28, 2025 | 15.17M |
| January 31, 2025 | 15.15M |
| December 31, 2024 | 15.13M |
| November 30, 2024 | 15.11M |
| October 31, 2024 | 15.09M |
| September 30, 2024 | 15.06M |
| August 31, 2024 | 15.04M |
| July 31, 2024 | 15.01M |
| June 30, 2024 | 14.98M |
| May 31, 2024 | 14.95M |
| April 30, 2024 | 14.92M |
| Date | Value |
|---|---|
| March 31, 2024 | 14.88M |
| February 29, 2024 | 14.85M |
| January 31, 2024 | 14.82M |
| December 31, 2023 | 14.79M |
| November 30, 2023 | 14.77M |
| October 31, 2023 | 14.74M |
| September 30, 2023 | 14.72M |
| August 31, 2023 | 14.69M |
| July 31, 2023 | 14.66M |
| June 30, 2023 | 14.64M |
| May 31, 2023 | 14.61M |
| April 30, 2023 | 14.57M |
| March 31, 2023 | 14.53M |
| February 28, 2023 | 14.48M |
| January 31, 2023 | 14.43M |
| December 31, 2022 | 14.38M |
| November 30, 2022 | 14.33M |
| October 31, 2022 | 14.29M |
| September 30, 2022 | 14.26M |
| August 31, 2022 | 14.24M |
| July 31, 2022 | 14.23M |
| June 30, 2022 | 14.21M |
| May 31, 2022 | 14.18M |
| April 30, 2022 | 14.15M |
| March 31, 2022 | 14.11M |
News
Headline
Time (ET)
05/25 09:56
Basic Info
|
Texas Employment is at a current level of 15.21M, down from 15.24M last month and up from 15.20M one year ago. This is a change of -0.16% from last month and 0.09% from one year ago. |
| Report | Regional and State Employment and Unemployment |
| Categories | Employment , Hours and Wages |
| Region | Texas |
| Source | Bureau of Labor Statistics |
Stats
| Last Value | 15.21M |
| Latest Period | Apr 2026 |
| Last Updated | May 22 2026, 10:34 EDT |
| Next Release | Jun 23 2026, 10:30 EDT |
| Average Growth Rate | 2.13% |
| Value from Last Month | 15.24M |
| Change from Last Month | -0.16% |
| Value from 1 Year Ago | 15.20M |
| Change from 1 Year Ago | 0.09% |
| Frequency | Monthly |
| Adjustment | Seasonally Adjusted |
| Download Source File |