

Texas Nonfarm Payrolls MoM (I:TCNPSM)
0.30K for Apr 2026
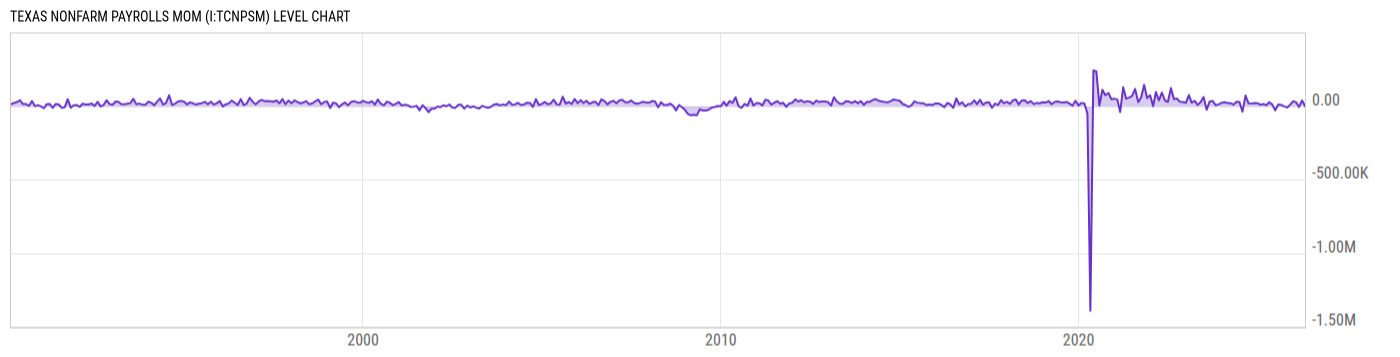
Level Chart
Basic Info
|
Texas Nonfarm Payrolls MoM is at a current level of 0.30K, down from 37.30K last month and down from 25.60K one year ago. This is a change of -99.20% from last month and -98.83% from one year ago. |
| Report | Regional and State Employment and Unemployment |
| Categories | Employment , Hours and Wages |
| Region | Texas |
| Source | Bureau of Labor Statistics |
Stats
| Last Value | 0.30K |
| Latest Period | Apr 2026 |
| Last Updated | May 22 2026, 11:49 EDT |
| Next Release | Jun 23 2026, 10:30 EDT |
| Average Growth Rate | -167.5% |
| Value from Last Month | 37.30K |
| Change from Last Month | -99.20% |
| Value from 1 Year Ago | 25.60K |
| Change from 1 Year Ago | -98.83% |
| Frequency | Monthly |
| Adjustment | Seasonally Adjusted |
| Download Source File |
Historical Data
| Date | Value |
|---|---|
| April 30, 2026 | 0.30K |
| March 31, 2026 | 37.30K |
| February 28, 2026 | -6.40K |
| January 31, 2026 | 23.70K |
| December 31, 2025 | 32.90K |
| November 30, 2025 | 9.30K |
| October 31, 2025 | -9.80K |
| September 30, 2025 | -2.90K |
| August 31, 2025 | 7.50K |
| July 31, 2025 | 10.70K |
| June 30, 2025 | -29.50K |
| May 31, 2025 | 9.30K |
| April 30, 2025 | 25.60K |
| March 31, 2025 | 5.50K |
| February 28, 2025 | 13.50K |
| January 31, 2025 | 7.90K |
| December 31, 2024 | 18.80K |
| November 30, 2024 | 19.80K |
| October 31, 2024 | 16.20K |
| September 30, 2024 | 19.30K |
| August 31, 2024 | 70.90K |
| July 31, 2024 | -38.70K |
| June 30, 2024 | 26.60K |
| May 31, 2024 | 28.30K |
| April 30, 2024 | 9.30K |
| Date | Value |
|---|---|
| March 31, 2024 | 19.30K |
| February 29, 2024 | 19.70K |
| January 31, 2024 | 25.80K |
| December 31, 2023 | 21.70K |
| November 30, 2023 | 11.00K |
| October 31, 2023 | 4.90K |
| September 30, 2023 | 34.40K |
| August 31, 2023 | 30.90K |
| July 31, 2023 | -26.10K |
| June 30, 2023 | 60.90K |
| May 31, 2023 | 27.40K |
| April 30, 2023 | 6.60K |
| March 31, 2023 | 34.60K |
| February 28, 2023 | 22.70K |
| January 31, 2023 | 74.40K |
| December 31, 2022 | 21.10K |
| November 30, 2022 | 27.00K |
| October 31, 2022 | 28.10K |
| September 30, 2022 | 50.80K |
| August 31, 2022 | 46.80K |
| July 31, 2022 | 121.60K |
| June 30, 2022 | 27.80K |
| May 31, 2022 | 37.50K |
| April 30, 2022 | 90.90K |
| March 31, 2022 | 38.10K |
News
Headline
Time (ET)
06/01 07:10
05/29 08:15
05/25 09:56
Basic Info
|
Texas Nonfarm Payrolls MoM is at a current level of 0.30K, down from 37.30K last month and down from 25.60K one year ago. This is a change of -99.20% from last month and -98.83% from one year ago. |
| Report | Regional and State Employment and Unemployment |
| Categories | Employment , Hours and Wages |
| Region | Texas |
| Source | Bureau of Labor Statistics |
Stats
| Last Value | 0.30K |
| Latest Period | Apr 2026 |
| Last Updated | May 22 2026, 11:49 EDT |
| Next Release | Jun 23 2026, 10:30 EDT |
| Average Growth Rate | -167.5% |
| Value from Last Month | 37.30K |
| Change from Last Month | -99.20% |
| Value from 1 Year Ago | 25.60K |
| Change from 1 Year Ago | -98.83% |
| Frequency | Monthly |
| Adjustment | Seasonally Adjusted |
| Download Source File |
Related Indicators
| Texas Economy |
| Austin, TX Unemployment Rate | 3.20% |
| Dallas, TX Unemployment Rate | 3.90% |
| Houston, TX Unemployment Rate | 4.30% |
| Texas GDP | 2.277T Chn 2017 USD |
| Texas GDP YoY | 2.49% |
| Texas Labor Force | 15.87M |
| Texas Unemployment Rate | 4.30% |