

Texas Business-Cycle Index (I:TBCI)
397.66 for Mar 2026
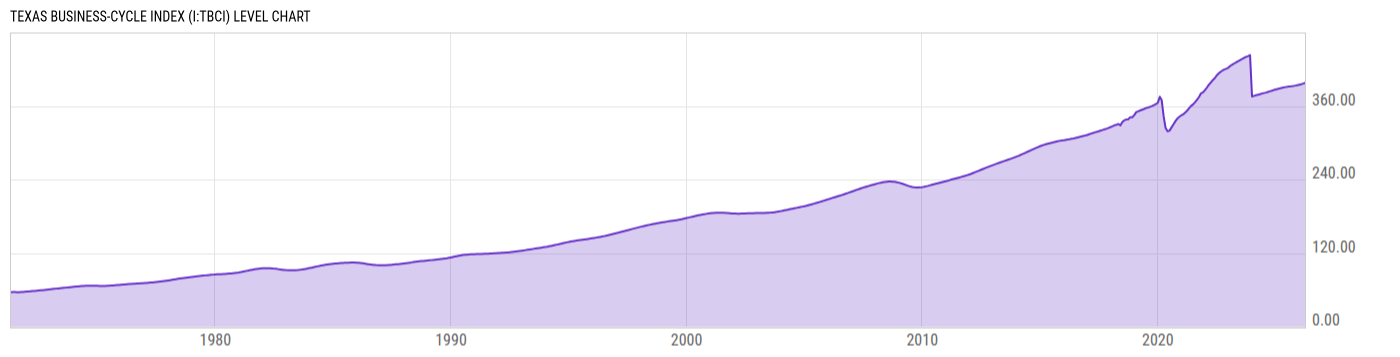
Level Chart
Basic Info
|
Texas Business-Cycle Index is at a current level of 397.66, up from 396.48 last month and up from 389.34 one year ago. This is a change of 0.30% from last month and 2.14% from one year ago. |
| Report | Texas Business-Cycle Indexes |
| Category | Economic Sentiment, Outlook and Activity |
| Region | Texas |
| Source | Federal Reserve Bank of Dallas |
Stats
| Last Value | 397.66 |
| Latest Period | Mar 2026 |
| Last Updated | May 22 2026, 10:05 EDT |
| Next Release | Jun 19 2026, 10:00 EDT (E) |
| Average Growth Rate | 3.61% |
| Value from Last Month | 396.48 |
| Change from Last Month | 0.30% |
| Value from 1 Year Ago | 389.34 |
| Change from 1 Year Ago | 2.14% |
| Frequency | Monthly |
| Unit | Index 1987=100 |
| Adjustment | N/A |
| Download Source File |
Historical Data
| Date | Value |
|---|---|
| March 31, 2026 | 397.66 |
| February 28, 2026 | 396.48 |
| January 31, 2026 | 395.54 |
| December 31, 2025 | 394.71 |
| November 30, 2025 | 393.93 |
| October 31, 2025 | 393.24 |
| September 30, 2025 | 392.67 |
| August 31, 2025 | 392.20 |
| July 31, 2025 | 391.81 |
| June 30, 2025 | 391.25 |
| May 31, 2025 | 390.83 |
| April 30, 2025 | 390.12 |
| March 31, 2025 | 389.34 |
| February 28, 2025 | 388.57 |
| January 31, 2025 | 387.80 |
| December 31, 2024 | 386.98 |
| November 30, 2024 | 386.01 |
| October 31, 2024 | 384.89 |
| September 30, 2024 | 383.91 |
| August 31, 2024 | 382.88 |
| July 31, 2024 | 381.84 |
| June 30, 2024 | 381.01 |
| May 31, 2024 | 380.27 |
| April 30, 2024 | 379.26 |
| March 31, 2024 | 378.29 |
| Date | Value |
|---|---|
| February 29, 2024 | 377.43 |
| January 31, 2024 | 376.52 |
| December 31, 2023 | 375.50 |
| November 30, 2023 | 443.09 |
| October 31, 2023 | 441.54 |
| September 30, 2023 | 440.23 |
| August 31, 2023 | 438.73 |
| July 31, 2023 | 436.78 |
| June 30, 2023 | 434.98 |
| May 31, 2023 | 433.15 |
| April 30, 2023 | 431.42 |
| March 31, 2023 | 429.41 |
| February 28, 2023 | 427.61 |
| January 31, 2023 | 425.70 |
| December 31, 2022 | 422.74 |
| November 30, 2022 | 421.02 |
| October 31, 2022 | 419.76 |
| September 30, 2022 | 418.01 |
| August 31, 2022 | 415.94 |
| July 31, 2022 | 412.93 |
| June 30, 2022 | 409.82 |
| May 31, 2022 | 405.37 |
| April 30, 2022 | 402.16 |
| March 31, 2022 | 398.34 |
| February 28, 2022 | 394.37 |
News
Headline
Time (ET)
05/13 15:57
05/01 16:52
04/30 13:32
04/30 09:10
04/23 08:36
Basic Info
|
Texas Business-Cycle Index is at a current level of 397.66, up from 396.48 last month and up from 389.34 one year ago. This is a change of 0.30% from last month and 2.14% from one year ago. |
| Report | Texas Business-Cycle Indexes |
| Category | Economic Sentiment, Outlook and Activity |
| Region | Texas |
| Source | Federal Reserve Bank of Dallas |
Stats
| Last Value | 397.66 |
| Latest Period | Mar 2026 |
| Last Updated | May 22 2026, 10:05 EDT |
| Next Release | Jun 19 2026, 10:00 EDT (E) |
| Average Growth Rate | 3.61% |
| Value from Last Month | 396.48 |
| Change from Last Month | 0.30% |
| Value from 1 Year Ago | 389.34 |
| Change from 1 Year Ago | 2.14% |
| Frequency | Monthly |
| Unit | Index 1987=100 |
| Adjustment | N/A |
| Download Source File |