

Singapore/Malaysia Rubber Price (I:SMRP)
Level Chart
Basic Info
|
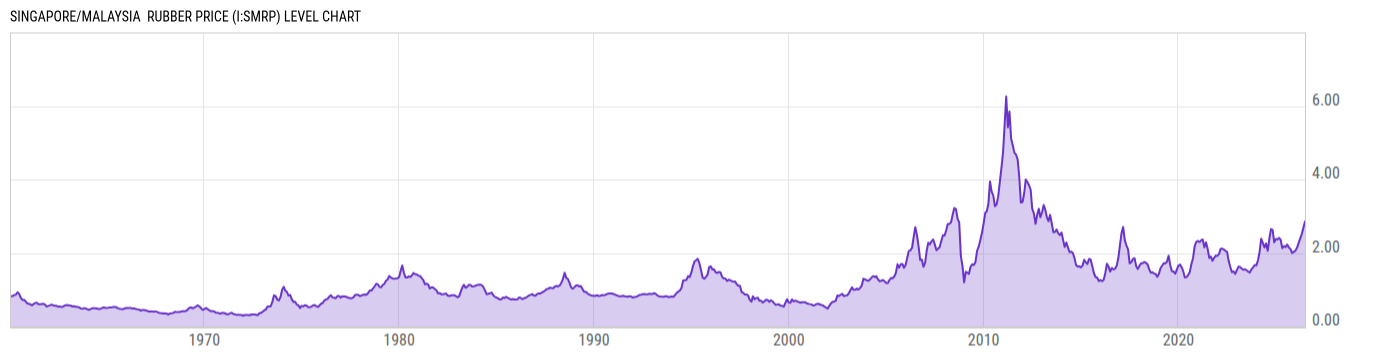
Singapore/Malaysia Rubber Price is at a current level of 2.86, up from 2.69 last month and up from 2.16 one year ago. This is a change of 6.32% from last month and 32.41% from one year ago. |
|
The Singapore/Malaysia Rubber Price measures the overall price in US dollars per Kilogram. This is a significant metric because Malaysia is one of the largest producers of rubber in the world. Rubber is important to many consumers. Historically, rubber prices peaked in 2011 because of supply concerns in Asia. Prices reached as high as $6.25 per kilogram during this time. |
| Report | Commodity Markets Review |
| Categories | Agriculture and Livestock , Chemicals , Metals |
| Region | N/A |
| Source | World Bank |
Stats
| Last Value | 2.86 |
| Latest Period | Jun 2026 |
| Last Updated | Jul 6 2026, 11:00 EDT |
| Next Release | Aug 5 2026, 11:00 EDT (E) |
| Average Growth Rate | 4.40% |
| Value from Last Month | 2.69 |
| Change from Last Month | 6.32% |
| Value from 1 Year Ago | 2.16 |
| Change from 1 Year Ago | 32.41% |
| Frequency | Monthly |
| Unit | USD per Kilogram |
| Adjustment | N/A |
| Download Source File | |
| Notes | RSS3 grade, Singapore Commodity Exchange Ltd (SICOM) nearby contract beginning 2004; during 2000 to 2003, Singapore RSS1; previously Malaysia RSS1. |
Historical Data
| Date | Value |
|---|---|
| June 30, 2026 | 2.86 |
| May 31, 2026 | 2.69 |
| April 30, 2026 | 2.51 |
| March 31, 2026 | 2.39 |
| February 28, 2026 | 2.26 |
| January 31, 2026 | 2.14 |
| December 31, 2025 | 2.06 |
| November 30, 2025 | 2.03 |
| October 31, 2025 | 2.00 |
| September 30, 2025 | 2.11 |
| August 31, 2025 | 2.15 |
| July 31, 2025 | 2.23 |
| June 30, 2025 | 2.16 |
| May 31, 2025 | 2.19 |
| April 30, 2025 | 2.13 |
| March 31, 2025 | 2.36 |
| February 28, 2025 | 2.41 |
| January 31, 2025 | 2.37 |
| December 31, 2024 | 2.38 |
| November 30, 2024 | 2.29 |
| October 31, 2024 | 2.63 |
| September 30, 2024 | 2.65 |
| August 31, 2024 | 2.39 |
| July 31, 2024 | 2.06 |
| June 30, 2024 | 2.26 |
| Date | Value |
|---|---|
| May 31, 2024 | 2.15 |
| April 30, 2024 | 2.276 |
| March 31, 2024 | 2.390 |
| February 29, 2024 | 2.024 |
| January 31, 2024 | 1.804 |
| December 31, 2023 | 1.662 |
| November 30, 2023 | 1.675 |
| October 31, 2023 | 1.607 |
| September 30, 2023 | 1.554 |
| August 31, 2023 | 1.470 |
| July 31, 2023 | 1.492 |
| June 30, 2023 | 1.534 |
| May 31, 2023 | 1.557 |
| April 30, 2023 | 1.541 |
| March 31, 2023 | 1.581 |
| February 28, 2023 | 1.617 |
| January 31, 2023 | 1.63 |
| December 31, 2022 | 1.536 |
| November 30, 2022 | 1.432 |
| October 31, 2022 | 1.496 |
| September 30, 2022 | 1.48 |
| August 31, 2022 | 1.609 |
| July 31, 2022 | 1.779 |
| June 30, 2022 | 2.030 |
| May 31, 2022 | 2.058 |
News
Basic Info
|
Singapore/Malaysia Rubber Price is at a current level of 2.86, up from 2.69 last month and up from 2.16 one year ago. This is a change of 6.32% from last month and 32.41% from one year ago. |
|
The Singapore/Malaysia Rubber Price measures the overall price in US dollars per Kilogram. This is a significant metric because Malaysia is one of the largest producers of rubber in the world. Rubber is important to many consumers. Historically, rubber prices peaked in 2011 because of supply concerns in Asia. Prices reached as high as $6.25 per kilogram during this time. |
| Report | Commodity Markets Review |
| Categories | Agriculture and Livestock , Chemicals , Metals |
| Region | N/A |
| Source | World Bank |
Stats
| Last Value | 2.86 |
| Latest Period | Jun 2026 |
| Last Updated | Jul 6 2026, 11:00 EDT |
| Next Release | Aug 5 2026, 11:00 EDT (E) |
| Average Growth Rate | 4.40% |
| Value from Last Month | 2.69 |
| Change from Last Month | 6.32% |
| Value from 1 Year Ago | 2.16 |
| Change from 1 Year Ago | 32.41% |
| Frequency | Monthly |
| Unit | USD per Kilogram |
| Adjustment | N/A |
| Download Source File | |
| Notes | RSS3 grade, Singapore Commodity Exchange Ltd (SICOM) nearby contract beginning 2004; during 2000 to 2003, Singapore RSS1; previously Malaysia RSS1. |