

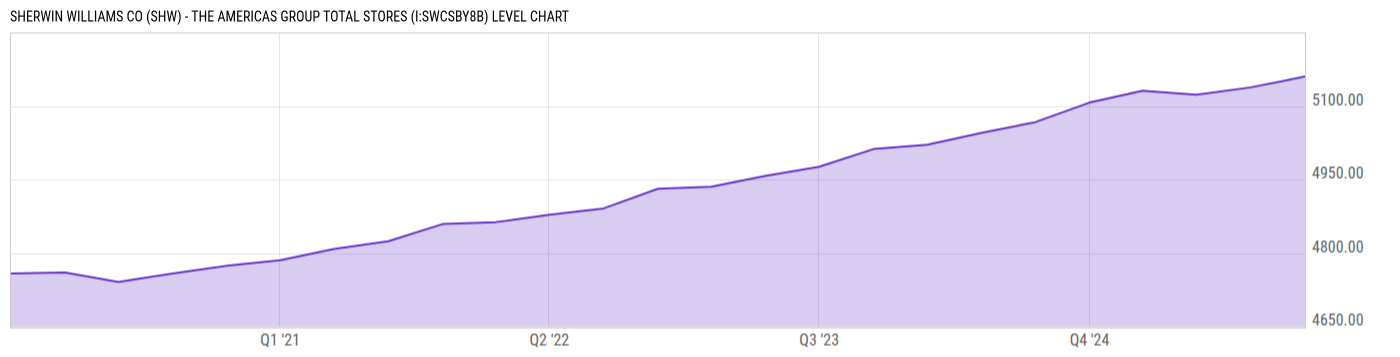
Sherwin Williams Co (SHW) - The Americas Group Total Stores (I:SWCSBY8B)
5160.00 for Q4 2025
Level Chart
Basic Info
|
Sherwin Williams Co (SHW) - The Americas Group Total Stores is at a current level of 5160.00, up from 5138.00 last quarter and up from 5107.00 one year ago. This is a change of 0.43% from last quarter and 1.04% from one year ago. |
| Report | Fiscal.ai |
| Category | Segments & KPIs |
| Region | United States |
| Source | Fiscal.ai |
|
Data provided via Fiscal.ai |
Stats
| Last Value | 5160.00 |
| Latest Period | Dec 2025 |
| Last Updated | Mar 23 2026, 14:14 EDT |
| Next Release | Jul 15 2026, 08:30 EDT (E) |
| Average Growth Rate | 1.36% |
| Value from Last Quarter | 5138.00 |
| Change from Last Quarter | 0.43% |
| Value from 1 Year Ago | 5107.00 |
| Change from 1 Year Ago | 1.04% |
| Frequency | Quarterly |
| Adjustment | N/A |
| Download Source File |
Historical Data
| Date | Value |
|---|---|
| December 31, 2025 | 5160.00 |
| September 30, 2025 | 5138.00 |
| June 30, 2025 | 5123.00 |
| March 31, 2025 | 5131.00 |
| December 31, 2024 | 5107.00 |
| September 30, 2024 | 5067.00 |
| June 30, 2024 | 5045.00 |
| March 31, 2024 | 5021.00 |
| December 31, 2023 | 5012.00 |
| September 30, 2023 | 4976.00 |
| June 30, 2023 | 4957.00 |
| March 31, 2023 | 4935.00 |
| December 31, 2022 | 4931.00 |
| Date | Value |
|---|---|
| September 30, 2022 | 4891.00 |
| June 30, 2022 | 4878.00 |
| March 31, 2022 | 4863.00 |
| December 31, 2021 | 4859.00 |
| September 30, 2021 | 4824.00 |
| June 30, 2021 | 4808.00 |
| March 31, 2021 | 4785.00 |
| December 31, 2020 | 4774.00 |
| September 30, 2020 | 4758.00 |
| June 30, 2020 | 4741.00 |
| March 31, 2020 | 4760.00 |
| December 31, 2019 | 4758.00 |
News
Headline
Time (ET)
05/22 14:40
05/11 16:10
05/08 08:40
Basic Info
|
Sherwin Williams Co (SHW) - The Americas Group Total Stores is at a current level of 5160.00, up from 5138.00 last quarter and up from 5107.00 one year ago. This is a change of 0.43% from last quarter and 1.04% from one year ago. |
| Report | Fiscal.ai |
| Category | Segments & KPIs |
| Region | United States |
| Source | Fiscal.ai |
|
Data provided via Fiscal.ai |
Stats
| Last Value | 5160.00 |
| Latest Period | Dec 2025 |
| Last Updated | Mar 23 2026, 14:14 EDT |
| Next Release | Jul 15 2026, 08:30 EDT (E) |
| Average Growth Rate | 1.36% |
| Value from Last Quarter | 5138.00 |
| Change from Last Quarter | 0.43% |
| Value from 1 Year Ago | 5107.00 |
| Change from 1 Year Ago | 1.04% |
| Frequency | Quarterly |
| Adjustment | N/A |
| Download Source File |