

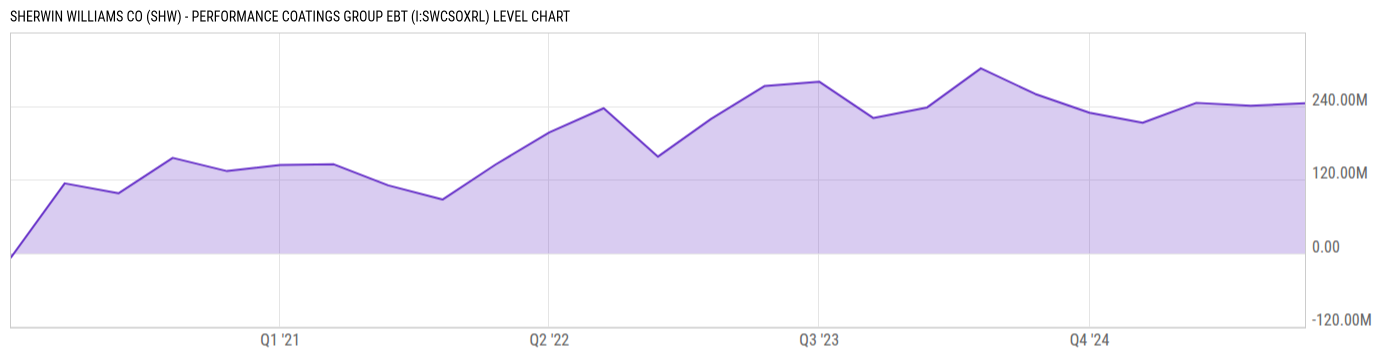
Sherwin Williams Co (SHW) - Performance Coatings Group EBT (I:SWCSOXRL)
244.60M USD for Q4 2025
Level Chart
Basic Info
|
Sherwin Williams Co (SHW) - Performance Coatings Group EBT is at a current level of 244.60M, up from 240.30M last quarter and up from 229.00M one year ago. This is a change of 1.79% from last quarter and 6.81% from one year ago. |
| Report | Fiscal.ai |
| Category | Segments & KPIs |
| Region | United States |
| Source | Fiscal.ai |
|
Data provided via Fiscal.ai |
Stats
| Last Value | 244.60M |
| Latest Period | Dec 2025 |
| Last Updated | Mar 23 2026, 14:14 EDT |
| Next Release | Jul 15 2026, 08:30 EDT (E) |
| Average Growth Rate | -248.5% |
| Value from Last Quarter | 240.30M |
| Change from Last Quarter | 1.79% |
| Value from 1 Year Ago | 229.00M |
| Change from 1 Year Ago | 6.81% |
| Frequency | Quarterly |
| Unit | USD |
| Adjustment | N/A |
| Download Source File |
Historical Data
| Date | Value |
|---|---|
| December 31, 2025 | 244.60M |
| September 30, 2025 | 240.30M |
| June 30, 2025 | 245.10M |
| March 31, 2025 | 212.70M |
| December 31, 2024 | 229.00M |
| September 30, 2024 | 259.70M |
| June 30, 2024 | 301.50M |
| March 31, 2024 | 237.70M |
| December 31, 2023 | 220.30M |
| September 30, 2023 | 279.70M |
| June 30, 2023 | 272.70M |
| March 31, 2023 | 218.90M |
| December 31, 2022 | 157.30M |
| Date | Value |
|---|---|
| September 30, 2022 | 236.30M |
| June 30, 2022 | 196.80M |
| March 31, 2022 | 144.50M |
| December 31, 2021 | 87.20M |
| September 30, 2021 | 110.40M |
| June 30, 2021 | 144.80M |
| March 31, 2021 | 143.80M |
| December 31, 2020 | 133.70M |
| September 30, 2020 | 155.30M |
| June 30, 2020 | 97.40M |
| March 31, 2020 | 113.70M |
| December 31, 2019 | -7.40M |
News
Headline
Time (ET)
05/22 14:40
05/11 16:10
05/08 08:40
Basic Info
|
Sherwin Williams Co (SHW) - Performance Coatings Group EBT is at a current level of 244.60M, up from 240.30M last quarter and up from 229.00M one year ago. This is a change of 1.79% from last quarter and 6.81% from one year ago. |
| Report | Fiscal.ai |
| Category | Segments & KPIs |
| Region | United States |
| Source | Fiscal.ai |
|
Data provided via Fiscal.ai |
Stats
| Last Value | 244.60M |
| Latest Period | Dec 2025 |
| Last Updated | Mar 23 2026, 14:14 EDT |
| Next Release | Jul 15 2026, 08:30 EDT (E) |
| Average Growth Rate | -248.5% |
| Value from Last Quarter | 240.30M |
| Change from Last Quarter | 1.79% |
| Value from 1 Year Ago | 229.00M |
| Change from 1 Year Ago | 6.81% |
| Frequency | Quarterly |
| Unit | USD |
| Adjustment | N/A |
| Download Source File |