

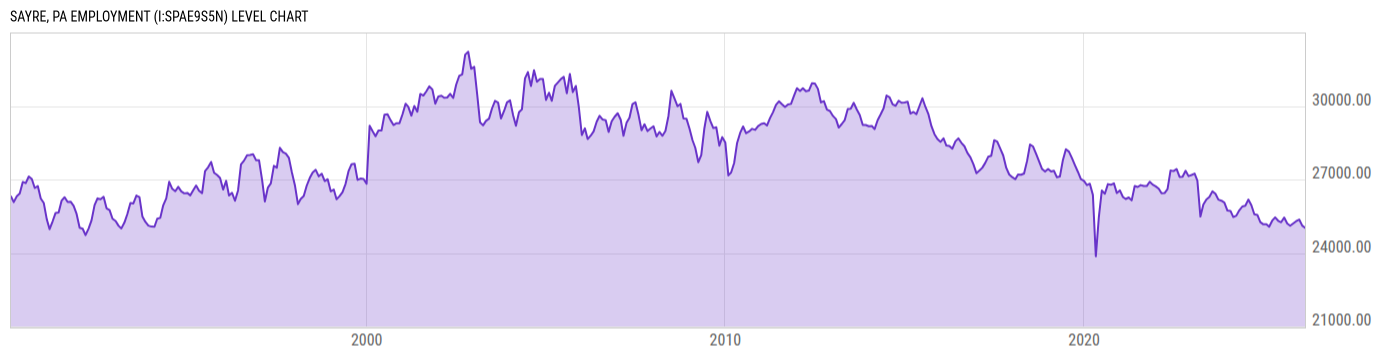
Sayre, PA Employment (I:SPAE9S5N)
25027.00 for Feb 2026
Level Chart
Basic Info
|
Sayre, PA Employment is at a current level of 25027.00, down from 25117.00 last month and down from 25069.00 one year ago. This is a change of -0.36% from last month and -0.17% from one year ago. |
| Report | Metropolitan Area Employment and Unemployment |
| Categories | Employment , Hours and Wages |
| Region | N/A |
| Source | Bureau of Labor Statistics |
Stats
| Last Value | 25027.00 |
| Latest Period | Feb 2026 |
| Last Updated | May 2 2026, 19:05 EDT |
| Next Release | May 19 2026, 10:30 EDT |
| Average Growth Rate | -0.03% |
| Value from Last Month | 25117.00 |
| Change from Last Month | -0.36% |
| Value from 1 Year Ago | 25069.00 |
| Change from 1 Year Ago | -0.17% |
| Frequency | Monthly |
| Adjustment | Not Seasonally Adjusted |
| Download Source File | |
| Notes | Micropolitan Statistical Area. |
Historical Data
| Date | Value |
|---|---|
| February 28, 2026 | 25027.00 |
| January 31, 2026 | 25117.00 |
| December 31, 2025 | 25367.00 |
| November 30, 2025 | 25299.00 |
| October 31, 2025 | |
| September 30, 2025 | 25113.00 |
| August 31, 2025 | 25202.00 |
| July 31, 2025 | 25449.00 |
| June 30, 2025 | 25254.00 |
| May 31, 2025 | 25315.00 |
| April 30, 2025 | 25454.00 |
| March 31, 2025 | 25319.00 |
| February 28, 2025 | 25069.00 |
| January 31, 2025 | 25170.00 |
| December 31, 2024 | 25169.00 |
| November 30, 2024 | 25261.00 |
| October 31, 2024 | 25552.00 |
| September 30, 2024 | 25584.00 |
| August 31, 2024 | 25950.00 |
| July 31, 2024 | 26180.00 |
| June 30, 2024 | 25927.00 |
| May 31, 2024 | 25898.00 |
| April 30, 2024 | 25742.00 |
| March 31, 2024 | 25526.00 |
| February 29, 2024 | 25467.00 |
| Date | Value |
|---|---|
| January 31, 2024 | 25718.00 |
| December 31, 2023 | 25730.00 |
| November 30, 2023 | 26059.00 |
| October 31, 2023 | 26135.00 |
| September 30, 2023 | 26178.00 |
| August 31, 2023 | 26416.00 |
| July 31, 2023 | 26515.00 |
| June 30, 2023 | 26285.00 |
| May 31, 2023 | 26187.00 |
| April 30, 2023 | 25977.00 |
| March 31, 2023 | 25488.00 |
| February 28, 2023 | 26957.00 |
| January 31, 2023 | 27239.00 |
| December 31, 2022 | 27184.00 |
| November 30, 2022 | 27138.00 |
| October 31, 2022 | 27354.00 |
| September 30, 2022 | 27110.00 |
| August 31, 2022 | 27105.00 |
| July 31, 2022 | 27430.00 |
| June 30, 2022 | 27342.00 |
| May 31, 2022 | 27369.00 |
| April 30, 2022 | 26604.00 |
| March 31, 2022 | 26448.00 |
| February 28, 2022 | 26437.00 |
| January 31, 2022 | 26625.00 |
News
Headline
Time (ET)
04/23 12:07
Basic Info
|
Sayre, PA Employment is at a current level of 25027.00, down from 25117.00 last month and down from 25069.00 one year ago. This is a change of -0.36% from last month and -0.17% from one year ago. |
| Report | Metropolitan Area Employment and Unemployment |
| Categories | Employment , Hours and Wages |
| Region | N/A |
| Source | Bureau of Labor Statistics |
Stats
| Last Value | 25027.00 |
| Latest Period | Feb 2026 |
| Last Updated | May 2 2026, 19:05 EDT |
| Next Release | May 19 2026, 10:30 EDT |
| Average Growth Rate | -0.03% |
| Value from Last Month | 25117.00 |
| Change from Last Month | -0.36% |
| Value from 1 Year Ago | 25069.00 |
| Change from 1 Year Ago | -0.17% |
| Frequency | Monthly |
| Adjustment | Not Seasonally Adjusted |
| Download Source File | |
| Notes | Micropolitan Statistical Area. |