

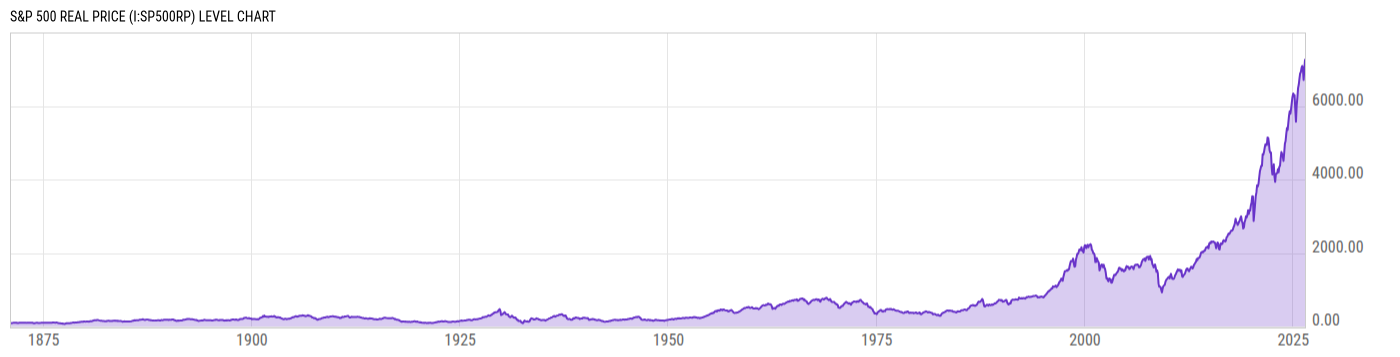
S&P 500 Real Price (I:SP500RP)
7259.22 USD for May 2026
Level Chart
Basic Info
|
S&P 500 Real Price is at a current level of 7259.22, up from 6974.97 last month and up from 6015.53 one year ago. This is a change of 4.08% from last month and 20.67% from one year ago. |
| Report | Shiller S&P 500 PE 10 |
| Category | Market Indices and Statistics |
| Region | United States |
| Source | Robert Shiller |
Stats
| Last Value | 7259.22 |
| Latest Period | May 2026 |
| Last Updated | May 8 2026, 19:02 EDT |
| Next Release | Jun 8 2026, 19:00 EDT (E) |
| Average Growth Rate | 3.81% |
| Value from Last Month | 6974.97 |
| Change from Last Month | 4.08% |
| Value from 1 Year Ago | 6015.53 |
| Change from 1 Year Ago | 20.67% |
| Frequency | Monthly |
| Unit | USD |
| Adjustment | N/A |
| Download Source File |
Historical Data
| Date | Value |
|---|---|
| May 31, 2026 | 7259.22 |
| April 30, 2026 | 6974.97 |
| March 31, 2026 | 6706.23 |
| February 28, 2026 | 7020.36 |
| January 31, 2026 | 7089.58 |
| December 31, 2025 | 7037.65 |
| November 30, 2025 | 6921.03 |
| October 31, 2025 | 6892.52 |
| September 30, 2025 | 6745.86 |
| August 31, 2025 | 6583.19 |
| July 31, 2025 | 6486.26 |
| June 30, 2025 | 6221.06 |
| May 31, 2025 | 6015.53 |
| April 30, 2025 | 5570.17 |
| March 31, 2025 | 5914.77 |
| February 28, 2025 | 6298.00 |
| January 31, 2025 | 6263.99 |
| December 31, 2024 | 6338.09 |
| November 30, 2024 | 6254.91 |
| October 31, 2024 | 6106.47 |
| September 30, 2024 | 5932.95 |
| August 31, 2024 | 5791.25 |
| July 31, 2024 | 5859.22 |
| June 30, 2024 | 5735.89 |
| May 31, 2024 | 5547.19 |
| Date | Value |
|---|---|
| April 30, 2024 | 5347.07 |
| March 31, 2024 | 5399.33 |
| February 29, 2024 | 5232.85 |
| January 31, 2024 | 5048.07 |
| December 31, 2023 | 4970.24 |
| November 30, 2023 | 4716.02 |
| October 31, 2023 | 4505.32 |
| September 30, 2023 | 4632.91 |
| August 31, 2023 | 4694.83 |
| July 31, 2023 | 4748.11 |
| June 30, 2023 | 4579.41 |
| May 31, 2023 | 4367.16 |
| April 30, 2023 | 4349.40 |
| March 31, 2023 | 4197.13 |
| February 28, 2023 | 4281.05 |
| January 31, 2023 | 4175.06 |
| December 31, 2022 | 4164.67 |
| November 30, 2022 | 4142.54 |
| October 31, 2022 | 3936.12 |
| September 30, 2022 | 4084.11 |
| August 31, 2022 | 4412.48 |
| July 31, 2022 | 4151.81 |
| June 30, 2022 | 4137.76 |
| May 31, 2022 | 4338.11 |
| April 30, 2022 | 4735.31 |
News
Headline
Time (ET)
05/13 15:57
Basic Info
|
S&P 500 Real Price is at a current level of 7259.22, up from 6974.97 last month and up from 6015.53 one year ago. This is a change of 4.08% from last month and 20.67% from one year ago. |
| Report | Shiller S&P 500 PE 10 |
| Category | Market Indices and Statistics |
| Region | United States |
| Source | Robert Shiller |
Stats
| Last Value | 7259.22 |
| Latest Period | May 2026 |
| Last Updated | May 8 2026, 19:02 EDT |
| Next Release | Jun 8 2026, 19:00 EDT (E) |
| Average Growth Rate | 3.81% |
| Value from Last Month | 6974.97 |
| Change from Last Month | 4.08% |
| Value from 1 Year Ago | 6015.53 |
| Change from 1 Year Ago | 20.67% |
| Frequency | Monthly |
| Unit | USD |
| Adjustment | N/A |
| Download Source File |