

S&P 500 Real Earnings (I:SP500RE)
279.26 USD for Mar 2026
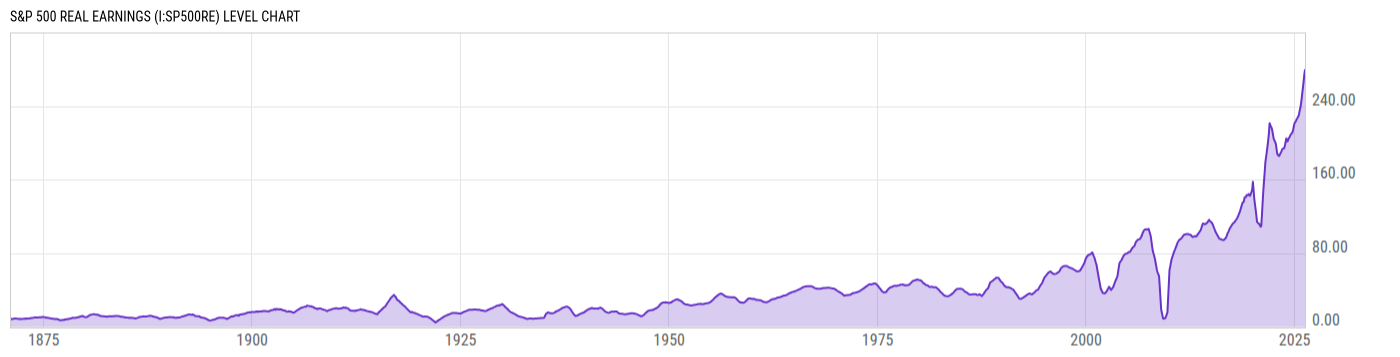
Level Chart
Basic Info
|
S&P 500 Real Earnings is at a current level of 279.26, up from 274.04 last month and up from 225.49 one year ago. This is a change of 1.90% from last month and 23.85% from one year ago. |
| Report | Shiller S&P 500 PE 10 |
| Category | Market Indices and Statistics |
| Region | United States |
| Source | Robert Shiller |
Stats
| Last Value | 279.26 |
| Latest Period | Mar 2026 |
| Last Updated | May 8 2026, 19:03 EDT |
| Next Release | Jun 8 2026, 19:00 EDT (E) |
| Average Growth Rate | 3.13% |
| Value from Last Month | 274.04 |
| Change from Last Month | 1.90% |
| Value from 1 Year Ago | 225.49 |
| Change from 1 Year Ago | 23.85% |
| Frequency | Monthly |
| Unit | USD |
| Adjustment | N/A |
| Download Source File |
Historical Data
| Date | Value |
|---|---|
| March 31, 2026 | 279.26 |
| February 28, 2026 | 274.04 |
| January 31, 2026 | 267.15 |
| December 31, 2025 | 259.93 |
| November 30, 2025 | 253.76 |
| October 31, 2025 | 246.82 |
| September 30, 2025 | 241.03 |
| August 31, 2025 | 237.29 |
| July 31, 2025 | 233.60 |
| June 30, 2025 | 229.58 |
| May 31, 2025 | 228.35 |
| April 30, 2025 | 226.81 |
| March 31, 2025 | 225.49 |
| February 28, 2025 | 223.73 |
| January 31, 2025 | 222.45 |
| December 31, 2024 | 221.61 |
| November 30, 2024 | 218.21 |
| October 31, 2024 | 214.61 |
| September 30, 2024 | 211.37 |
| August 31, 2024 | 210.48 |
| July 31, 2024 | 209.41 |
| June 30, 2024 | 208.41 |
| May 31, 2024 | 206.59 |
| April 30, 2024 | 205.03 |
| March 31, 2024 | 203.92 |
| Date | Value |
|---|---|
| February 29, 2024 | 201.51 |
| January 31, 2024 | 203.13 |
| December 31, 2023 | 204.60 |
| November 30, 2023 | 200.18 |
| October 31, 2023 | 196.90 |
| September 30, 2023 | 193.96 |
| August 31, 2023 | 193.70 |
| July 31, 2023 | 193.40 |
| June 30, 2023 | 192.62 |
| May 31, 2023 | 190.40 |
| April 30, 2023 | 188.81 |
| March 31, 2023 | 187.67 |
| February 28, 2023 | 185.66 |
| January 31, 2023 | 185.84 |
| December 31, 2022 | 186.45 |
| November 30, 2022 | 188.30 |
| October 31, 2022 | 193.22 |
| September 30, 2022 | 199.14 |
| August 31, 2022 | 200.80 |
| July 31, 2022 | 202.51 |
| June 30, 2022 | 204.27 |
| May 31, 2022 | 208.73 |
| April 30, 2022 | 213.08 |
| March 31, 2022 | 216.32 |
| February 28, 2022 | 217.46 |
News
Headline
Time (ET)
05/13 15:57
Basic Info
|
S&P 500 Real Earnings is at a current level of 279.26, up from 274.04 last month and up from 225.49 one year ago. This is a change of 1.90% from last month and 23.85% from one year ago. |
| Report | Shiller S&P 500 PE 10 |
| Category | Market Indices and Statistics |
| Region | United States |
| Source | Robert Shiller |
Stats
| Last Value | 279.26 |
| Latest Period | Mar 2026 |
| Last Updated | May 8 2026, 19:03 EDT |
| Next Release | Jun 8 2026, 19:00 EDT (E) |
| Average Growth Rate | 3.13% |
| Value from Last Month | 274.04 |
| Change from Last Month | 1.90% |
| Value from 1 Year Ago | 225.49 |
| Change from 1 Year Ago | 23.85% |
| Frequency | Monthly |
| Unit | USD |
| Adjustment | N/A |
| Download Source File |