

San Marcos, TX Employment (I:SMTXE)
44815.00 for Apr 2026
Level Chart
Basic Info
|
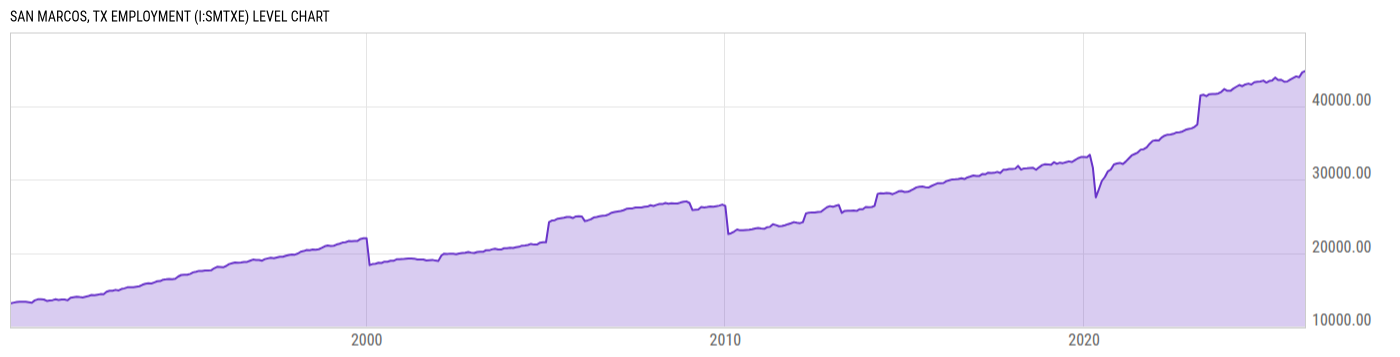
San Marcos, TX Employment is at a current level of 44815.00, up from 44763.00 last month and down from 44958.00 one year ago. This is a change of 0.12% from last month and -0.32% from one year ago. |
| Report | Metropolitan Area Employment and Unemployment |
| Categories | Employment , Hours and Wages |
| Region | N/A |
| Source | Bureau of Labor Statistics |
Stats
| Last Value | 44815.00 |
| Latest Period | Apr 2026 |
| Last Updated | Jun 3 2026, 15:26 EDT |
| Next Release | Jul 1 2026, 10:30 EDT |
| Average Growth Rate | 3.57% |
| Value from Last Month | 44763.00 |
| Change from Last Month | 0.12% |
| Value from 1 Year Ago | 44958.00 |
| Change from 1 Year Ago | -0.32% |
| Frequency | Monthly |
| Adjustment | Not Seasonally Adjusted |
| Download Source File |
Historical Data
| Date | Value |
|---|---|
| April 30, 2026 | 44815.00 |
| March 31, 2026 | 44763.00 |
| February 28, 2026 | 44749.00 |
| January 31, 2026 | 44575.00 |
| December 31, 2025 | 45058.00 |
| November 30, 2025 | 44961.00 |
| October 31, 2025 | |
| September 30, 2025 | 44917.00 |
| August 31, 2025 | 44611.00 |
| July 31, 2025 | 44671.00 |
| June 30, 2025 | 44739.00 |
| May 31, 2025 | 44639.00 |
| April 30, 2025 | 44958.00 |
| March 31, 2025 | 44569.00 |
| February 28, 2025 | 44351.00 |
| January 31, 2025 | 44283.00 |
| December 31, 2024 | 44264.00 |
| November 30, 2024 | 44148.00 |
| October 31, 2024 | 44068.00 |
| September 30, 2024 | 43983.00 |
| August 31, 2024 | 43602.00 |
| July 31, 2024 | 43731.00 |
| June 30, 2024 | 43658.00 |
| May 31, 2024 | 43448.00 |
| April 30, 2024 | 43629.00 |
| Date | Value |
|---|---|
| March 31, 2024 | 43375.00 |
| February 29, 2024 | 42359.00 |
| January 31, 2024 | 42063.00 |
| December 31, 2023 | 42068.00 |
| November 30, 2023 | 42311.00 |
| October 31, 2023 | 41932.00 |
| September 30, 2023 | 41701.00 |
| August 31, 2023 | 41619.00 |
| July 31, 2023 | 41630.00 |
| June 30, 2023 | 41604.00 |
| May 31, 2023 | 41343.00 |
| April 30, 2023 | 41529.00 |
| March 31, 2023 | 41420.00 |
| February 28, 2023 | 37491.00 |
| January 31, 2023 | 37174.00 |
| December 31, 2022 | 36957.00 |
| November 30, 2022 | 36875.00 |
| October 31, 2022 | 36761.00 |
| September 30, 2022 | 36532.00 |
| August 31, 2022 | 36440.00 |
| July 31, 2022 | 36400.00 |
| June 30, 2022 | 36217.00 |
| May 31, 2022 | 36112.00 |
| April 30, 2022 | 36102.00 |
| March 31, 2022 | 35958.00 |
News
Headline
Time (ET)
05/29 08:15
Basic Info
|
San Marcos, TX Employment is at a current level of 44815.00, up from 44763.00 last month and down from 44958.00 one year ago. This is a change of 0.12% from last month and -0.32% from one year ago. |
| Report | Metropolitan Area Employment and Unemployment |
| Categories | Employment , Hours and Wages |
| Region | N/A |
| Source | Bureau of Labor Statistics |
Stats
| Last Value | 44815.00 |
| Latest Period | Apr 2026 |
| Last Updated | Jun 3 2026, 15:26 EDT |
| Next Release | Jul 1 2026, 10:30 EDT |
| Average Growth Rate | 3.57% |
| Value from Last Month | 44763.00 |
| Change from Last Month | 0.12% |
| Value from 1 Year Ago | 44958.00 |
| Change from 1 Year Ago | -0.32% |
| Frequency | Monthly |
| Adjustment | Not Seasonally Adjusted |
| Download Source File |