

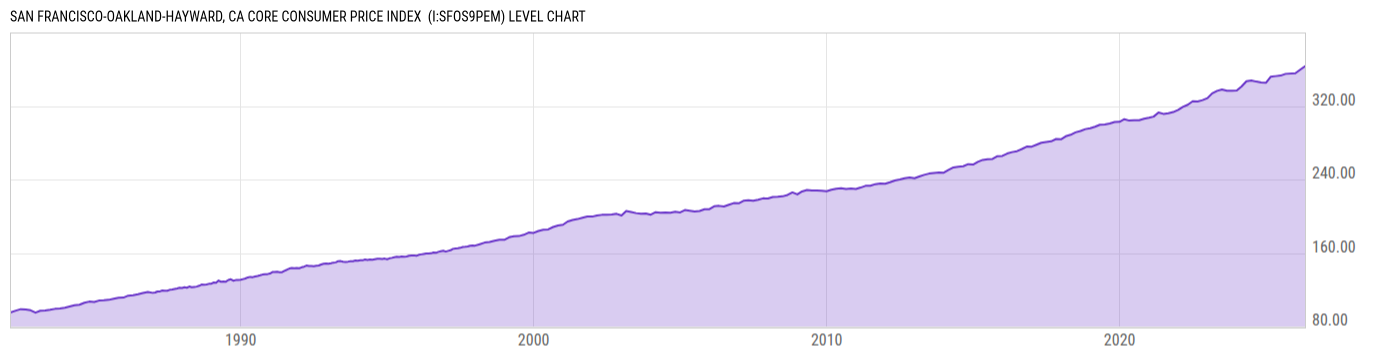
San Francisco-Oakland-Hayward, CA Core Consumer Price Index (I:SFOS9PEM)
363.15 for Apr 2026
Level Chart
Basic Info
|
San Francisco-Oakland-Hayward, CA Core Consumer Price Index is at a current level of 363.15, up from 359.48 two months ago and up from 352.51 one year ago. This is a change of 1.02% from two months ago and 3.02% from one year ago. |
| Report | Consumer Price Index |
| Category | Consumer Prices |
| Region | N/A |
| Source | Bureau of Labor Statistics |
Stats
| Last Value | 363.15 |
| Latest Period | Apr 2026 |
| Last Updated | May 15 2026, 18:21 EDT |
| Next Release | Jun 10 2026, 08:30 EDT |
| Average Growth Rate | 2.44% |
| Value from Two Months Ago | 359.48 |
| Change from Two Months Ago | 1.02% |
| Value from 1 Year Ago | 352.51 |
| Change from 1 Year Ago | 3.02% |
| Frequency | Bimonthly |
| Unit | Index 1982-84=100 |
| Adjustment | Not Seasonally Adjusted |
| Download Source File | |
| Notes | All items less food and energy. |
Historical Data
| Date | Value |
|---|---|
| April 30, 2026 | 363.15 |
| February 28, 2026 | 359.48 |
| December 31, 2025 | 355.66 |
| August 31, 2025 | 354.97 |
| June 30, 2025 | 353.08 |
| April 30, 2025 | 352.51 |
| February 28, 2025 | 351.87 |
| December 31, 2024 | 345.32 |
| October 31, 2024 | 345.60 |
| August 31, 2024 | 346.55 |
| June 30, 2024 | 347.67 |
| April 30, 2024 | 346.94 |
| February 29, 2024 | 341.21 |
| December 31, 2023 | 336.78 |
| October 31, 2023 | 336.52 |
| August 31, 2023 | 336.66 |
| June 30, 2023 | 337.91 |
| April 30, 2023 | 336.46 |
| February 28, 2023 | 333.75 |
| December 31, 2022 | 328.55 |
| October 31, 2022 | 326.37 |
| August 31, 2022 | 324.96 |
| June 30, 2022 | 325.18 |
| April 30, 2022 | 321.35 |
| February 28, 2022 | 318.96 |
| Date | Value |
|---|---|
| December 31, 2021 | 315.86 |
| October 31, 2021 | 313.38 |
| August 31, 2021 | 312.03 |
| June 30, 2021 | 311.42 |
| April 30, 2021 | 312.89 |
| February 28, 2021 | 308.43 |
| December 31, 2020 | 307.17 |
| October 31, 2020 | 306.04 |
| August 31, 2020 | 304.51 |
| June 30, 2020 | 304.52 |
| April 30, 2020 | 304.12 |
| February 29, 2020 | 305.60 |
| December 31, 2019 | 302.80 |
| October 31, 2019 | 302.60 |
| August 31, 2019 | 300.89 |
| June 30, 2019 | 299.98 |
| April 30, 2019 | 299.62 |
| February 28, 2019 | 297.40 |
| December 31, 2018 | 295.75 |
| October 31, 2018 | 294.83 |
| August 31, 2018 | 292.74 |
| June 30, 2018 | 291.27 |
| April 30, 2018 | 288.63 |
| February 28, 2018 | 287.01 |
| December 31, 2017 | 283.68 |
News
Headline
Time (ET)
05/14 06:14
Basic Info
|
San Francisco-Oakland-Hayward, CA Core Consumer Price Index is at a current level of 363.15, up from 359.48 two months ago and up from 352.51 one year ago. This is a change of 1.02% from two months ago and 3.02% from one year ago. |
| Report | Consumer Price Index |
| Category | Consumer Prices |
| Region | N/A |
| Source | Bureau of Labor Statistics |
Stats
| Last Value | 363.15 |
| Latest Period | Apr 2026 |
| Last Updated | May 15 2026, 18:21 EDT |
| Next Release | Jun 10 2026, 08:30 EDT |
| Average Growth Rate | 2.44% |
| Value from Two Months Ago | 359.48 |
| Change from Two Months Ago | 1.02% |
| Value from 1 Year Ago | 352.51 |
| Change from 1 Year Ago | 3.02% |
| Frequency | Bimonthly |
| Unit | Index 1982-84=100 |
| Adjustment | Not Seasonally Adjusted |
| Download Source File | |
| Notes | All items less food and energy. |