

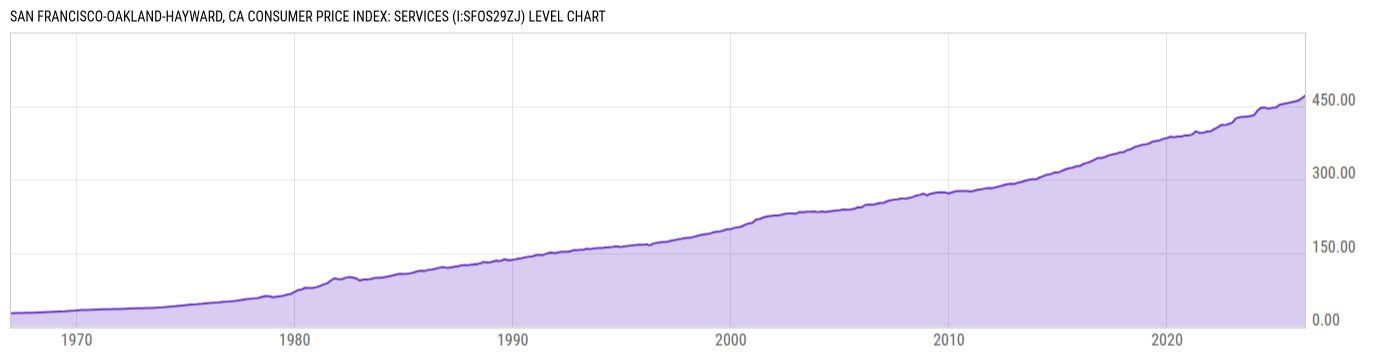
San Francisco-Oakland-Hayward, CA Consumer Price Index: Services (I:SFOS29ZJ)
471.09 for Apr 2026
Level Chart
Basic Info
|
San Francisco-Oakland-Hayward, CA Consumer Price Index: Services is at a current level of 471.09, up from 464.87 two months ago and up from 454.09 one year ago. This is a change of 1.34% from two months ago and 3.74% from one year ago. |
| Report | Consumer Price Index |
| Category | Consumer Prices |
| Region | N/A |
| Source | Bureau of Labor Statistics |
Stats
| Last Value | 471.09 |
| Latest Period | Apr 2026 |
| Last Updated | May 15 2026, 18:21 EDT |
| Next Release | Jun 10 2026, 08:30 EDT |
| Average Growth Rate | 4.34% |
| Value from Two Months Ago | 464.87 |
| Change from Two Months Ago | 1.34% |
| Value from 1 Year Ago | 454.09 |
| Change from 1 Year Ago | 3.74% |
| Frequency | Bimonthly |
| Unit | Index 1982-84=100 |
| Adjustment | Not Seasonally Adjusted |
| Download Source File |
Historical Data
| Date | Value |
|---|---|
| April 30, 2026 | 471.09 |
| February 28, 2026 | 464.87 |
| December 31, 2025 | 460.53 |
| August 31, 2025 | 457.28 |
| June 30, 2025 | 455.52 |
| April 30, 2025 | 454.09 |
| February 28, 2025 | 452.69 |
| December 31, 2024 | 446.84 |
| October 31, 2024 | 446.25 |
| August 31, 2024 | 444.63 |
| June 30, 2024 | 446.32 |
| April 30, 2024 | 446.72 |
| February 29, 2024 | 441.19 |
| December 31, 2023 | 431.65 |
| October 31, 2023 | 429.78 |
| August 31, 2023 | 428.12 |
| June 30, 2023 | 427.82 |
| April 30, 2023 | 427.13 |
| February 28, 2023 | 424.69 |
| December 31, 2022 | 415.99 |
| October 31, 2022 | 413.35 |
| August 31, 2022 | 410.98 |
| June 30, 2022 | 411.72 |
| April 30, 2022 | 406.48 |
| February 28, 2022 | 402.72 |
| Date | Value |
|---|---|
| December 31, 2021 | 398.31 |
| October 31, 2021 | 397.91 |
| August 31, 2021 | 395.23 |
| June 30, 2021 | 395.06 |
| April 30, 2021 | 398.34 |
| February 28, 2021 | 392.06 |
| December 31, 2020 | 389.88 |
| October 31, 2020 | 390.13 |
| August 31, 2020 | 387.84 |
| June 30, 2020 | 387.64 |
| April 30, 2020 | 386.10 |
| February 29, 2020 | 387.18 |
| December 31, 2019 | 384.55 |
| October 31, 2019 | 382.95 |
| August 31, 2019 | 379.78 |
| June 30, 2019 | 378.74 |
| April 30, 2019 | 377.21 |
| February 28, 2019 | 372.83 |
| December 31, 2018 | 371.67 |
| October 31, 2018 | 370.50 |
| August 31, 2018 | 368.04 |
| June 30, 2018 | 365.70 |
| April 30, 2018 | 361.57 |
| February 28, 2018 | 359.71 |
| December 31, 2017 | 355.53 |
News
Headline
Time (ET)
05/22 09:11
05/14 06:14
Basic Info
|
San Francisco-Oakland-Hayward, CA Consumer Price Index: Services is at a current level of 471.09, up from 464.87 two months ago and up from 454.09 one year ago. This is a change of 1.34% from two months ago and 3.74% from one year ago. |
| Report | Consumer Price Index |
| Category | Consumer Prices |
| Region | N/A |
| Source | Bureau of Labor Statistics |
Stats
| Last Value | 471.09 |
| Latest Period | Apr 2026 |
| Last Updated | May 15 2026, 18:21 EDT |
| Next Release | Jun 10 2026, 08:30 EDT |
| Average Growth Rate | 4.34% |
| Value from Two Months Ago | 464.87 |
| Change from Two Months Ago | 1.34% |
| Value from 1 Year Ago | 454.09 |
| Change from 1 Year Ago | 3.74% |
| Frequency | Bimonthly |
| Unit | Index 1982-84=100 |
| Adjustment | Not Seasonally Adjusted |
| Download Source File |