

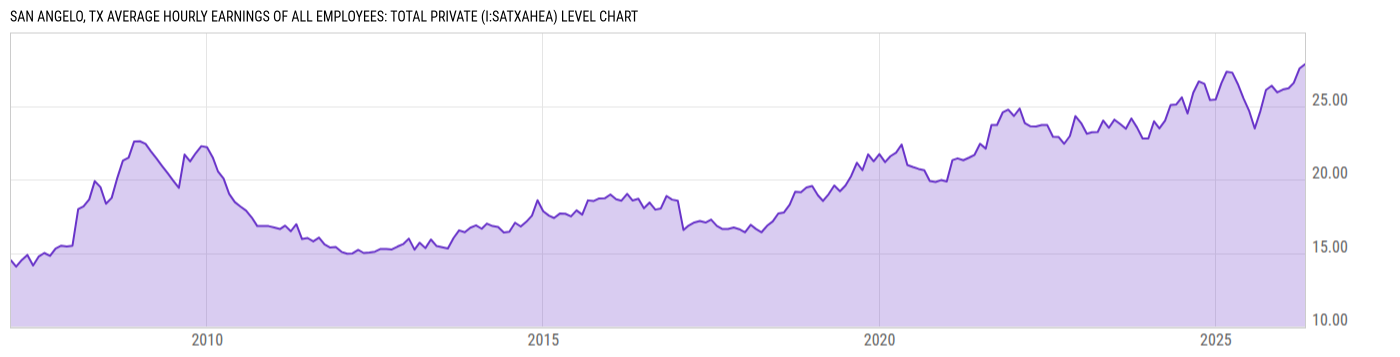
San Angelo, TX Average Hourly Earnings of All Employees: Total Private (I:SATXAHEA)
27.84 USD for Apr 2026
Level Chart
Basic Info
|
San Angelo, TX Average Hourly Earnings of All Employees: Total Private is at a current level of 27.84, up from 27.55 last month and up from 26.50 one year ago. This is a change of 1.05% from last month and 5.06% from one year ago. |
| Report | Metropolitan Area Employment and Unemployment |
| Categories | Employment , Hours and Wages |
| Region | N/A |
| Source | Bureau of Labor Statistics |
Stats
| Last Value | 27.84 |
| Latest Period | Apr 2026 |
| Last Updated | May 22 2026, 19:12 EDT |
| Next Release | Jun 3 2026, 10:30 EDT |
| Average Growth Rate | 3.95% |
| Value from Last Month | 27.55 |
| Change from Last Month | 1.05% |
| Value from 1 Year Ago | 26.50 |
| Change from 1 Year Ago | 5.06% |
| Frequency | Monthly |
| Unit | USD |
| Adjustment | Not Seasonally Adjusted |
| Download Source File |
Historical Data
| Date | Value |
|---|---|
| April 30, 2026 | 27.84 |
| March 31, 2026 | 27.55 |
| February 28, 2026 | 26.57 |
| January 31, 2026 | 26.21 |
| December 31, 2025 | 26.12 |
| November 30, 2025 | 25.92 |
| October 31, 2025 | 26.38 |
| September 30, 2025 | 26.09 |
| August 31, 2025 | 24.67 |
| July 31, 2025 | 23.47 |
| June 30, 2025 | 24.69 |
| May 31, 2025 | 25.52 |
| April 30, 2025 | 26.50 |
| March 31, 2025 | 27.27 |
| February 28, 2025 | 27.33 |
| January 31, 2025 | 26.56 |
| December 31, 2024 | 25.45 |
| November 30, 2024 | 25.40 |
| October 31, 2024 | 26.50 |
| September 30, 2024 | 26.67 |
| August 31, 2024 | 25.90 |
| July 31, 2024 | 24.49 |
| June 30, 2024 | 25.59 |
| May 31, 2024 | 25.11 |
| April 30, 2024 | 25.07 |
| Date | Value |
|---|---|
| March 31, 2024 | 24.00 |
| February 29, 2024 | 23.48 |
| January 31, 2024 | 23.96 |
| December 31, 2023 | 22.79 |
| November 30, 2023 | 22.79 |
| October 31, 2023 | 23.53 |
| September 30, 2023 | 24.15 |
| August 31, 2023 | 23.45 |
| July 31, 2023 | 23.77 |
| June 30, 2023 | 24.07 |
| May 31, 2023 | 23.52 |
| April 30, 2023 | 24.01 |
| March 31, 2023 | 23.23 |
| February 28, 2023 | 23.21 |
| January 31, 2023 | 23.11 |
| December 31, 2022 | 23.84 |
| November 30, 2022 | 24.31 |
| October 31, 2022 | 22.96 |
| September 30, 2022 | 22.43 |
| August 31, 2022 | 22.89 |
| July 31, 2022 | 22.91 |
| June 30, 2022 | 23.70 |
| May 31, 2022 | 23.71 |
| April 30, 2022 | 23.61 |
| March 31, 2022 | 23.62 |
News
Headline
Time (ET)
Basic Info
|
San Angelo, TX Average Hourly Earnings of All Employees: Total Private is at a current level of 27.84, up from 27.55 last month and up from 26.50 one year ago. This is a change of 1.05% from last month and 5.06% from one year ago. |
| Report | Metropolitan Area Employment and Unemployment |
| Categories | Employment , Hours and Wages |
| Region | N/A |
| Source | Bureau of Labor Statistics |
Stats
| Last Value | 27.84 |
| Latest Period | Apr 2026 |
| Last Updated | May 22 2026, 19:12 EDT |
| Next Release | Jun 3 2026, 10:30 EDT |
| Average Growth Rate | 3.95% |
| Value from Last Month | 27.55 |
| Change from Last Month | 1.05% |
| Value from 1 Year Ago | 26.50 |
| Change from 1 Year Ago | 5.06% |
| Frequency | Monthly |
| Unit | USD |
| Adjustment | Not Seasonally Adjusted |
| Download Source File |