

Procter & Gamble Co (PG) - Organic Sales Growth (I:PGCPGOSG)
Level Chart
Basic Info
|
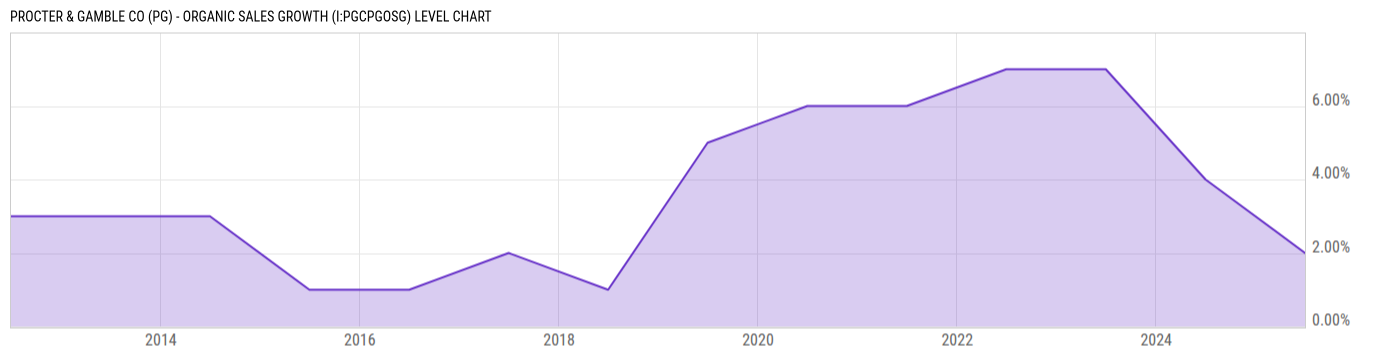
Procter & Gamble Co (PG) - Organic Sales Growth is at 2.00%, compared to 4.00% last year. This is lower than the long term average of 3.64%. |
|
Organic Sales Growth is a key financial metric used by companies, including Procter & Gamble (P&G), to assess the performance of their core business operations and exclude the impact of external factors like acquisitions, divestitures, and currency fluctuations. It provides insights into how much a company's revenue has grown from its existing operations and product lines, excluding any revenue generated from newly acquired businesses. |
| Report | Fiscal.ai |
| Category | Segments & KPIs |
| Region | United States |
| Source | Fiscal.ai |
|
Data provided via Fiscal.ai |
Stats
| Last Value | 2.00% |
| Latest Period | 2025 |
| Last Updated | Mar 23 2026, 14:13 EDT |
| Next Release | Feb 1 2027, 08:30 EST (E) |
| Long Term Average | 3.64% |
| Average Growth Rate | 25.16% |
| Value from 1 Year Ago | 4.00% |
| Change from 1 Year Ago | -50.00% |
| Frequency | Yearly |
| Unit | Percent |
| Adjustment | N/A |
| Download Source File |
Historical Data
| Date | Value |
|---|---|
| June 30, 2025 | 2.00% |
| June 30, 2024 | 4.00% |
| June 30, 2023 | 7.00% |
| June 30, 2022 | 7.00% |
| June 30, 2021 | 6.00% |
| June 30, 2020 | 6.00% |
| June 30, 2019 | 5.00% |
| Date | Value |
|---|---|
| June 30, 2018 | 1.00% |
| June 30, 2017 | 2.00% |
| June 30, 2016 | 1.00% |
| June 30, 2015 | 1.00% |
| June 30, 2014 | 3.00% |
| June 30, 2013 | 3.00% |
| June 30, 2012 | 3.00% |
News
Basic Info
|
Procter & Gamble Co (PG) - Organic Sales Growth is at 2.00%, compared to 4.00% last year. This is lower than the long term average of 3.64%. |
|
Organic Sales Growth is a key financial metric used by companies, including Procter & Gamble (P&G), to assess the performance of their core business operations and exclude the impact of external factors like acquisitions, divestitures, and currency fluctuations. It provides insights into how much a company's revenue has grown from its existing operations and product lines, excluding any revenue generated from newly acquired businesses. |
| Report | Fiscal.ai |
| Category | Segments & KPIs |
| Region | United States |
| Source | Fiscal.ai |
|
Data provided via Fiscal.ai |
Stats
| Last Value | 2.00% |
| Latest Period | 2025 |
| Last Updated | Mar 23 2026, 14:13 EDT |
| Next Release | Feb 1 2027, 08:30 EST (E) |
| Long Term Average | 3.64% |
| Average Growth Rate | 25.16% |
| Value from 1 Year Ago | 4.00% |
| Change from 1 Year Ago | -50.00% |
| Frequency | Yearly |
| Unit | Percent |
| Adjustment | N/A |
| Download Source File |