

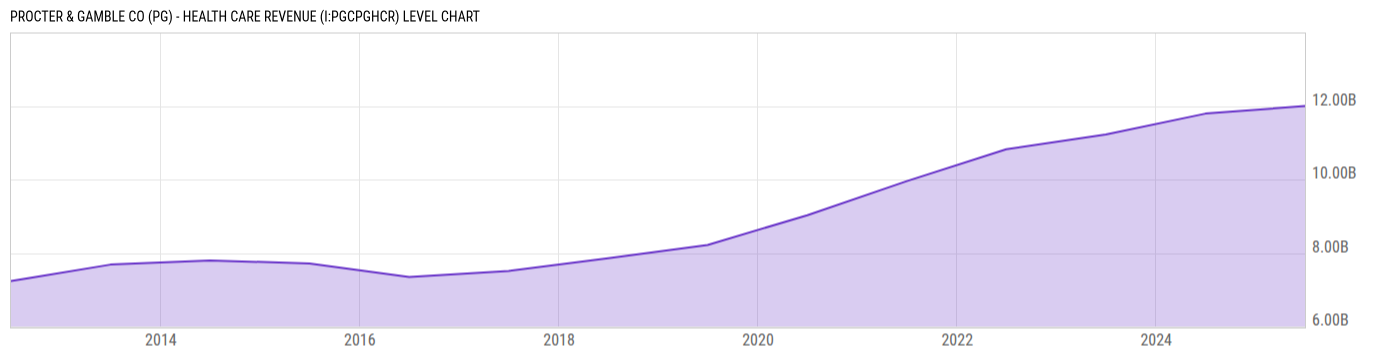
Procter & Gamble Co (PG) - Health Care Revenue (I:PGCPGHCR)
12.00B USD for 2025
Level Chart
Basic Info
|
Procter & Gamble Co (PG) - Health Care Revenue is at a current level of 12.00B, up from 11.79B one year ago. This is a change of 1.74% from one year ago. |
|
Health Care Revenue refers to the total revenue generated by Procter & Gamble (P&G) from its health care segment. |
| Report | Fiscal.ai |
| Category | Segments & KPIs |
| Region | United States |
| Source | Fiscal.ai |
|
Data provided via Fiscal.ai |
Stats
| Last Value | 12.00B |
| Latest Period | 2025 |
| Last Updated | Mar 23 2026, 14:13 EDT |
| Next Release | Feb 1 2027, 08:30 EST (E) |
| Average Growth Rate | 4.05% |
| Value from 1 Year Ago | 11.79B |
| Change from 1 Year Ago | 1.74% |
| Frequency | Yearly |
| Unit | USD |
| Adjustment | N/A |
| Download Source File |
Historical Data
| Date | Value |
|---|---|
| June 30, 2025 | 12.00B |
| June 30, 2024 | 11.79B |
| June 30, 2023 | 11.23B |
| June 30, 2022 | 10.82B |
| June 30, 2021 | 9.956B |
| June 30, 2020 | 9.028B |
| June 30, 2019 | 8.218B |
| Date | Value |
|---|---|
| June 30, 2018 | 7.857B |
| June 30, 2017 | 7.513B |
| June 30, 2016 | 7.35B |
| June 30, 2015 | 7.713B |
| June 30, 2014 | 7.798B |
| June 30, 2013 | 7.684B |
| June 30, 2012 | 7.235B |
News
Headline
Time (ET)
05/22 14:40
05/11 16:10
Basic Info
|
Procter & Gamble Co (PG) - Health Care Revenue is at a current level of 12.00B, up from 11.79B one year ago. This is a change of 1.74% from one year ago. |
|
Health Care Revenue refers to the total revenue generated by Procter & Gamble (P&G) from its health care segment. |
| Report | Fiscal.ai |
| Category | Segments & KPIs |
| Region | United States |
| Source | Fiscal.ai |
|
Data provided via Fiscal.ai |
Stats
| Last Value | 12.00B |
| Latest Period | 2025 |
| Last Updated | Mar 23 2026, 14:13 EDT |
| Next Release | Feb 1 2027, 08:30 EST (E) |
| Average Growth Rate | 4.05% |
| Value from 1 Year Ago | 11.79B |
| Change from 1 Year Ago | 1.74% |
| Frequency | Yearly |
| Unit | USD |
| Adjustment | N/A |
| Download Source File |