

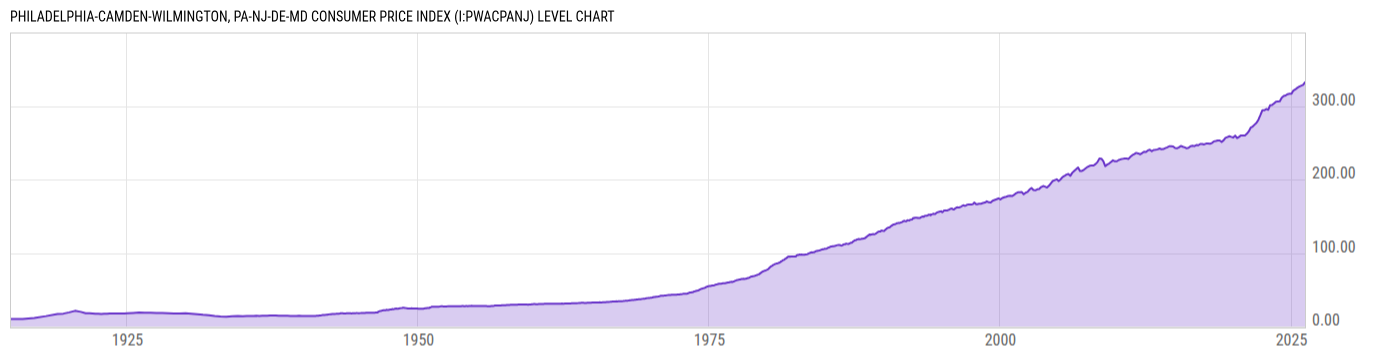
Philadelphia-Camden-Wilmington, PA-NJ-DE-MD Consumer Price Index (I:PWACPANJ)
332.30 for Feb 2026
Level Chart
Basic Info
|
Philadelphia-Camden-Wilmington, PA-NJ-DE-MD Consumer Price Index is at a current level of 332.30, up from 328.86 two months ago and up from 320.94 one year ago. This is a change of 1.05% from two months ago and 3.54% from one year ago. |
| Report | Consumer Price Index |
| Category | Consumer Prices |
| Region | N/A |
| Source | Bureau of Labor Statistics |
Stats
| Last Value | 332.30 |
| Latest Period | Feb 2026 |
| Last Updated | Mar 11 2026, 13:02 EDT |
| Next Release | May 12 2026, 08:30 EDT |
| Average Growth Rate | 2.33% |
| Value from Two Months Ago | 328.86 |
| Change from Two Months Ago | 1.05% |
| Value from 1 Year Ago | 320.94 |
| Change from 1 Year Ago | 3.54% |
| Frequency | Bimonthly |
| Unit | Index 1982-84=100 |
| Adjustment | Not Seasonally Adjusted |
| Download Source File | |
| Notes | All items. |
Historical Data
| Date | Value |
|---|---|
| February 28, 2026 | 332.30 |
| December 31, 2025 | 328.86 |
| August 31, 2025 | 326.33 |
| June 30, 2025 | 324.64 |
| April 30, 2025 | 322.55 |
| February 28, 2025 | 320.94 |
| December 31, 2024 | 316.54 |
| October 31, 2024 | 316.62 |
| August 31, 2024 | 316.06 |
| June 30, 2024 | 314.33 |
| April 30, 2024 | 313.50 |
| February 29, 2024 | 311.23 |
| December 31, 2023 | 306.39 |
| October 31, 2023 | 306.28 |
| August 31, 2023 | 305.74 |
| June 30, 2023 | 303.45 |
| April 30, 2023 | 301.22 |
| February 28, 2023 | 300.88 |
| December 31, 2022 | 294.88 |
| October 31, 2022 | 295.98 |
| August 31, 2022 | 294.13 |
| June 30, 2022 | 294.21 |
| April 30, 2022 | 287.60 |
| February 28, 2022 | 281.40 |
| December 31, 2021 | 277.16 |
| Date | Value |
|---|---|
| October 31, 2021 | 274.65 |
| August 31, 2021 | 272.04 |
| June 30, 2021 | 270.50 |
| April 30, 2021 | 265.36 |
| February 28, 2021 | 262.17 |
| December 31, 2020 | 259.99 |
| October 31, 2020 | 259.98 |
| August 31, 2020 | 259.96 |
| June 30, 2020 | 257.98 |
| April 30, 2020 | 256.35 |
| February 29, 2020 | 259.69 |
| December 31, 2019 | 257.19 |
| October 31, 2019 | 257.97 |
| August 31, 2019 | 258.88 |
| June 30, 2019 | 257.71 |
| April 30, 2019 | 256.53 |
| February 28, 2019 | 253.22 |
| December 31, 2018 | 251.15 |
| October 31, 2018 | 253.04 |
| August 31, 2018 | 253.08 |
| June 30, 2018 | 252.39 |
| April 30, 2018 | 251.85 |
| February 28, 2018 | 249.57 |
| December 31, 2017 | 248.62 |
| October 31, 2017 | 248.96 |
News
Headline
Time (ET)
04/21 12:24
04/20 11:18
04/20 08:46
Basic Info
|
Philadelphia-Camden-Wilmington, PA-NJ-DE-MD Consumer Price Index is at a current level of 332.30, up from 328.86 two months ago and up from 320.94 one year ago. This is a change of 1.05% from two months ago and 3.54% from one year ago. |
| Report | Consumer Price Index |
| Category | Consumer Prices |
| Region | N/A |
| Source | Bureau of Labor Statistics |
Stats
| Last Value | 332.30 |
| Latest Period | Feb 2026 |
| Last Updated | Mar 11 2026, 13:02 EDT |
| Next Release | May 12 2026, 08:30 EDT |
| Average Growth Rate | 2.33% |
| Value from Two Months Ago | 328.86 |
| Change from Two Months Ago | 1.05% |
| Value from 1 Year Ago | 320.94 |
| Change from 1 Year Ago | 3.54% |
| Frequency | Bimonthly |
| Unit | Index 1982-84=100 |
| Adjustment | Not Seasonally Adjusted |
| Download Source File | |
| Notes | All items. |