

US Disposable Personal Income Per Capita (I:USPCDPI)
Level Chart
Basic Info
|
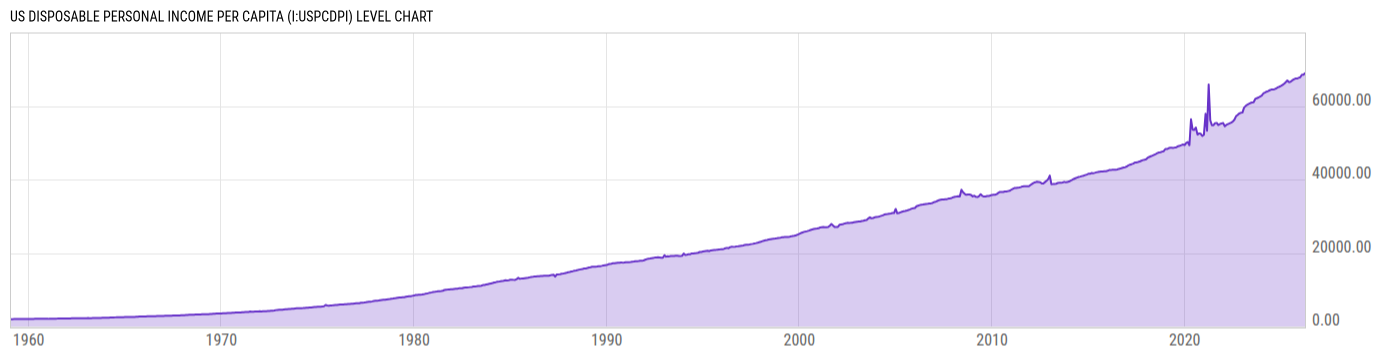
US Disposable Personal Income Per Capita is at a current level of 68496.00, down from 68565.00 last month and up from 66952.00 one year ago. This is a change of -0.10% from last month and 2.31% from one year ago. |
|
The US Disposable Personal Income per Capita indicates American household income net of taxes for each person. Disposable Personal Income per Capita in the US is an important metric in understanding the health of the economy through the lens of the average individual, by better understanding their spending ability. In January 2013, as tax laws increased tax rates for high-income households, there was a significant decrease in disposable personal income per capita from December 2012. |
| Report | Personal Income and Outlays |
| Category | Consumer & Household Statistics |
| Region | United States |
| Source | Bureau of Economic Analysis |
Stats
| Last Value | 68496.00 |
| Latest Period | Apr 2026 |
| Last Updated | May 28 2026, 08:43 EDT |
| Next Release | Jun 25 2026, 08:30 EDT |
| Average Growth Rate | 5.38% |
| Value from Last Month | 68565.00 |
| Change from Last Month | -0.10% |
| Value from 1 Year Ago | 66952.00 |
| Change from 1 Year Ago | 2.31% |
| Frequency | Monthly |
| Unit | USD |
| Adjustment | Seasonally Adjusted Annual Rate |
| Download Source File |
Historical Data
| Date | Value |
|---|---|
| April 30, 2026 | 68496.00 |
| March 31, 2026 | 68565.00 |
| February 28, 2026 | 68231.00 |
| January 31, 2026 | 68282.00 |
| December 31, 2025 | 67639.00 |
| November 30, 2025 | 67489.00 |
| October 31, 2025 | 67363.00 |
| September 30, 2025 | 67464.00 |
| August 31, 2025 | 67243.00 |
| July 31, 2025 | 66953.00 |
| June 30, 2025 | 66573.00 |
| May 31, 2025 | 66482.00 |
| April 30, 2025 | 66952.00 |
| March 31, 2025 | 66485.00 |
| February 28, 2025 | 66060.00 |
| January 31, 2025 | 65741.00 |
| December 31, 2024 | 65453.00 |
| November 30, 2024 | 65240.00 |
| October 31, 2024 | 65047.00 |
| September 30, 2024 | 64758.00 |
| August 31, 2024 | 64586.00 |
| July 31, 2024 | 64505.00 |
| June 30, 2024 | 64474.00 |
| May 31, 2024 | 64290.00 |
| April 30, 2024 | 64067.00 |
| Date | Value |
|---|---|
| March 31, 2024 | 63881.00 |
| February 29, 2024 | 63626.00 |
| January 31, 2024 | 63406.00 |
| December 31, 2023 | 62818.00 |
| November 30, 2023 | 62570.00 |
| October 31, 2023 | 62308.00 |
| September 30, 2023 | 62116.00 |
| August 31, 2023 | 61916.00 |
| July 31, 2023 | 61017.00 |
| June 30, 2023 | 60944.00 |
| May 31, 2023 | 60810.00 |
| April 30, 2023 | 60556.00 |
| March 31, 2023 | 60330.00 |
| February 28, 2023 | 59977.00 |
| January 31, 2023 | 59566.00 |
| December 31, 2022 | 58204.00 |
| November 30, 2022 | 58141.00 |
| October 31, 2022 | 57959.00 |
| September 30, 2022 | 57548.00 |
| August 31, 2022 | 57188.00 |
| July 31, 2022 | 56260.00 |
| June 30, 2022 | 55767.00 |
| May 31, 2022 | 55493.00 |
| April 30, 2022 | 55264.00 |
| March 31, 2022 | 55068.00 |
News
Basic Info
|
US Disposable Personal Income Per Capita is at a current level of 68496.00, down from 68565.00 last month and up from 66952.00 one year ago. This is a change of -0.10% from last month and 2.31% from one year ago. |
|
The US Disposable Personal Income per Capita indicates American household income net of taxes for each person. Disposable Personal Income per Capita in the US is an important metric in understanding the health of the economy through the lens of the average individual, by better understanding their spending ability. In January 2013, as tax laws increased tax rates for high-income households, there was a significant decrease in disposable personal income per capita from December 2012. |
| Report | Personal Income and Outlays |
| Category | Consumer & Household Statistics |
| Region | United States |
| Source | Bureau of Economic Analysis |
Stats
| Last Value | 68496.00 |
| Latest Period | Apr 2026 |
| Last Updated | May 28 2026, 08:43 EDT |
| Next Release | Jun 25 2026, 08:30 EDT |
| Average Growth Rate | 5.38% |
| Value from Last Month | 68565.00 |
| Change from Last Month | -0.10% |
| Value from 1 Year Ago | 66952.00 |
| Change from 1 Year Ago | 2.31% |
| Frequency | Monthly |
| Unit | USD |
| Adjustment | Seasonally Adjusted Annual Rate |
| Download Source File |
Related Indicators
| US Economy |
| ADP Employment Change | 122000.0 |
| Effective Federal Funds Rate | 3.62% |
| US Durable Goods New Orders MoM | 7.95% |
| US Housing Starts MoM | -2.79% |
| US Imports MoM | 2.34% |
| US Index of Consumer Sentiment | 44.80 |
| US Inflation Rate | 3.80% |
| US Initial Claims for Unemployment Insurance | 215000.0 |
| US ISM Manufacturing PMI | 54.00 |
| US Real GDP QoQ | 1.60% |
| US Retail and Food Services Sales MoM | 0.49% |
| US Unemployment Rate | 4.30% |