

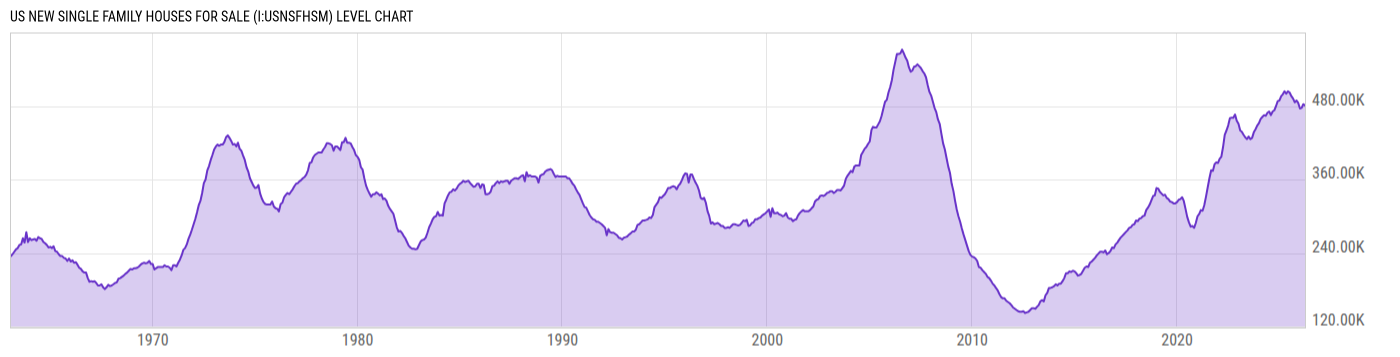
US New Single Family Houses For Sale (I:USNSFHSM)
481.00K for Mar 2026
Level Chart
Basic Info
|
US New Single Family Houses For Sale is at a current level of 481.00K, down from 483.00K last month and down from 504.00K one year ago. This is a change of -0.41% from last month and -4.56% from one year ago. |
| Report | New Residential Sales |
| Category | House Sales |
| Region | United States |
| Source | Census Bureau |
Stats
| Last Value | 481.00K |
| Latest Period | Mar 2026 |
| Last Updated | May 6 2026, 11:04 EDT |
| Next Release | May 28 2026, 10:00 EDT |
| Average Growth Rate | 1.33% |
| Value from Last Month | 483.00K |
| Change from Last Month | -0.41% |
| Value from 1 Year Ago | 504.00K |
| Change from 1 Year Ago | -4.56% |
| Frequency | Monthly |
| Adjustment | Seasonally Adjusted |
| Download Source File | |
| Notes | Seasonally adjusted. |
Historical Data
| Date | Value |
|---|---|
| March 31, 2026 | 481.00K |
| February 28, 2026 | 483.00K |
| January 31, 2026 | 477.00K |
| December 31, 2025 | 476.00K |
| November 30, 2025 | 485.00K |
| October 31, 2025 | 489.00K |
| September 30, 2025 | 486.00K |
| August 31, 2025 | 492.00K |
| July 31, 2025 | 496.00K |
| June 30, 2025 | 502.00K |
| May 31, 2025 | 504.00K |
| April 30, 2025 | 500.00K |
| March 31, 2025 | 504.00K |
| February 28, 2025 | 499.00K |
| January 31, 2025 | 496.00K |
| December 31, 2024 | 489.00K |
| November 30, 2024 | 488.00K |
| October 31, 2024 | 480.00K |
| September 30, 2024 | 473.00K |
| August 31, 2024 | 471.00K |
| July 31, 2024 | 465.00K |
| June 30, 2024 | 471.00K |
| May 31, 2024 | 469.00K |
| April 30, 2024 | 464.00K |
| March 31, 2024 | 465.00K |
| Date | Value |
|---|---|
| February 29, 2024 | 462.00K |
| January 31, 2024 | 459.00K |
| December 31, 2023 | 452.00K |
| November 30, 2023 | 448.00K |
| October 31, 2023 | 442.00K |
| September 30, 2023 | 437.00K |
| August 31, 2023 | 428.00K |
| July 31, 2023 | 426.00K |
| June 30, 2023 | 430.00K |
| May 31, 2023 | 426.00K |
| April 30, 2023 | 429.00K |
| March 31, 2023 | 433.00K |
| February 28, 2023 | 438.00K |
| January 31, 2023 | 440.00K |
| December 31, 2022 | 451.00K |
| November 30, 2022 | 456.00K |
| October 31, 2022 | 466.00K |
| September 30, 2022 | 461.00K |
| August 31, 2022 | 461.00K |
| July 31, 2022 | 460.00K |
| June 30, 2022 | 448.00K |
| May 31, 2022 | 440.00K |
| April 30, 2022 | 433.00K |
| March 31, 2022 | 413.00K |
| February 28, 2022 | 397.00K |
News
Headline
Time (ET)
05/15 07:05
Home Sales Activity in Canada Seen "Low" in Key Spring Season Despite April Lift, Says National Bank
05/14 11:37
05/14 11:11
05/14 07:24
Basic Info
|
US New Single Family Houses For Sale is at a current level of 481.00K, down from 483.00K last month and down from 504.00K one year ago. This is a change of -0.41% from last month and -4.56% from one year ago. |
| Report | New Residential Sales |
| Category | House Sales |
| Region | United States |
| Source | Census Bureau |
Stats
| Last Value | 481.00K |
| Latest Period | Mar 2026 |
| Last Updated | May 6 2026, 11:04 EDT |
| Next Release | May 28 2026, 10:00 EDT |
| Average Growth Rate | 1.33% |
| Value from Last Month | 483.00K |
| Change from Last Month | -0.41% |
| Value from 1 Year Ago | 504.00K |
| Change from 1 Year Ago | -4.56% |
| Frequency | Monthly |
| Adjustment | Seasonally Adjusted |
| Download Source File | |
| Notes | Seasonally adjusted. |