

New Jersey Average Hourly Earnings of All Employees: Total Private (I:NJAHEAET)
39.28 USD for Mar 2026
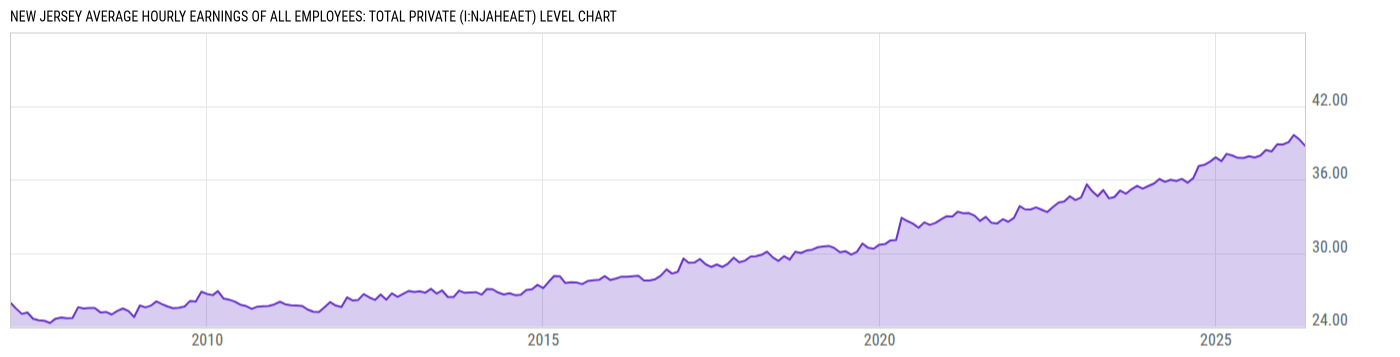
Level Chart
Basic Info
|
New Jersey Average Hourly Earnings of All Employees: Total Private is at a current level of 39.28, down from 39.63 last month and up from 37.96 one year ago. This is a change of -0.88% from last month and 3.48% from one year ago. |
| Report | Regional and State Employment and Unemployment |
| Categories | Employment , Hours and Wages |
| Region | New Jersey |
| Source | Bureau of Labor Statistics |
Stats
| Last Value | 39.28 |
| Latest Period | Mar 2026 |
| Last Updated | May 7 2026, 09:20 EDT |
| Next Release | May 22 2026, 10:30 EDT |
| Average Growth Rate | 2.26% |
| Value from Last Month | 39.63 |
| Change from Last Month | -0.88% |
| Value from 1 Year Ago | 37.96 |
| Change from 1 Year Ago | 3.48% |
| Frequency | Monthly |
| Unit | USD |
| Adjustment | Not Seasonally Adjusted |
| Download Source File | |
| Notes | In Dollars. |
Historical Data
| Date | Value |
|---|---|
| March 31, 2026 | 39.28 |
| February 28, 2026 | 39.63 |
| January 31, 2026 | 39.05 |
| December 31, 2025 | 38.86 |
| November 30, 2025 | 38.87 |
| October 31, 2025 | 38.29 |
| September 30, 2025 | 38.41 |
| August 31, 2025 | 37.96 |
| July 31, 2025 | 37.80 |
| June 30, 2025 | 37.90 |
| May 31, 2025 | 37.76 |
| April 30, 2025 | 37.77 |
| March 31, 2025 | 37.96 |
| February 28, 2025 | 38.09 |
| January 31, 2025 | 37.50 |
| December 31, 2024 | 37.81 |
| November 30, 2024 | 37.46 |
| October 31, 2024 | 37.20 |
| September 30, 2024 | 37.10 |
| August 31, 2024 | 36.11 |
| July 31, 2024 | 35.74 |
| June 30, 2024 | 36.05 |
| May 31, 2024 | 35.88 |
| April 30, 2024 | 35.98 |
| March 31, 2024 | 35.81 |
| Date | Value |
|---|---|
| February 29, 2024 | 36.04 |
| January 31, 2024 | 35.67 |
| December 31, 2023 | 35.47 |
| November 30, 2023 | 35.25 |
| October 31, 2023 | 35.48 |
| September 30, 2023 | 35.20 |
| August 31, 2023 | 34.84 |
| July 31, 2023 | 35.10 |
| June 30, 2023 | 34.57 |
| May 31, 2023 | 34.46 |
| April 30, 2023 | 35.14 |
| March 31, 2023 | 34.63 |
| February 28, 2023 | 35.06 |
| January 31, 2023 | 35.60 |
| December 31, 2022 | 34.54 |
| November 30, 2022 | 34.32 |
| October 31, 2022 | 34.63 |
| September 30, 2022 | 34.21 |
| August 31, 2022 | 34.12 |
| July 31, 2022 | 33.76 |
| June 30, 2022 | 33.34 |
| May 31, 2022 | 33.53 |
| April 30, 2022 | 33.72 |
| March 31, 2022 | 33.55 |
| February 28, 2022 | 33.57 |
News
Headline
Time (ET)
Basic Info
|
New Jersey Average Hourly Earnings of All Employees: Total Private is at a current level of 39.28, down from 39.63 last month and up from 37.96 one year ago. This is a change of -0.88% from last month and 3.48% from one year ago. |
| Report | Regional and State Employment and Unemployment |
| Categories | Employment , Hours and Wages |
| Region | New Jersey |
| Source | Bureau of Labor Statistics |
Stats
| Last Value | 39.28 |
| Latest Period | Mar 2026 |
| Last Updated | May 7 2026, 09:20 EDT |
| Next Release | May 22 2026, 10:30 EDT |
| Average Growth Rate | 2.26% |
| Value from Last Month | 39.63 |
| Change from Last Month | -0.88% |
| Value from 1 Year Ago | 37.96 |
| Change from 1 Year Ago | 3.48% |
| Frequency | Monthly |
| Unit | USD |
| Adjustment | Not Seasonally Adjusted |
| Download Source File | |
| Notes | In Dollars. |