

Michigan Unemployment Rate (I:MUR05)
5.00% for Apr 2026
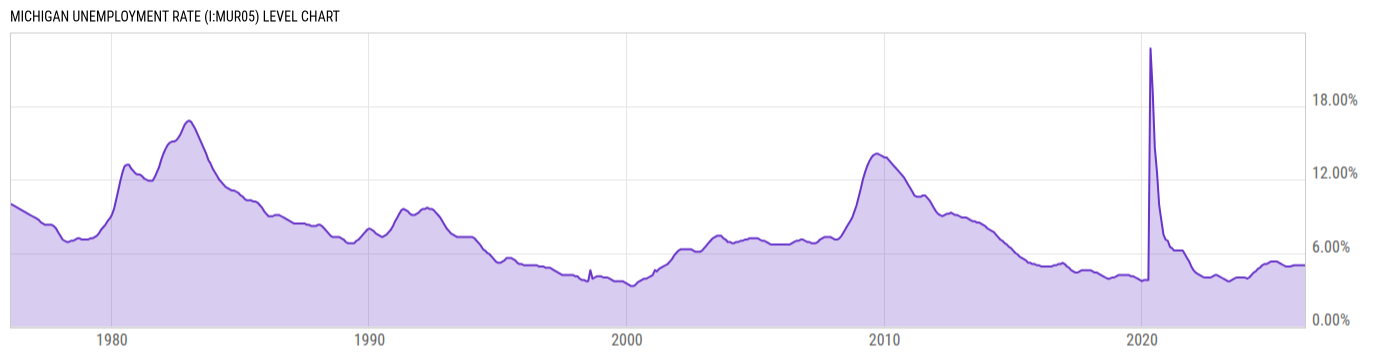
Level Chart
Basic Info
|
Michigan Unemployment Rate is at 5.00%, compared to 5.00% last month and 5.20% last year. This is lower than the long term average of 7.58%. |
| Report | Regional and State Employment and Unemployment |
| Categories | Employment , Hours and Wages |
| Region | Michigan |
| Source | Bureau of Labor Statistics |
Stats
| Last Value | 5.00% |
| Latest Period | Apr 2026 |
| Last Updated | May 22 2026, 10:31 EDT |
| Next Release | Jun 23 2026, 10:30 EDT |
| Long Term Average | 7.58% |
| Average Growth Rate | 5.51% |
| Value from Last Month | 5.00% |
| Change from Last Month | 0.00% |
| Value from 1 Year Ago | 5.20% |
| Change from 1 Year Ago | -3.85% |
| Frequency | Monthly |
| Unit | Percent |
| Adjustment | Seasonally Adjusted |
| Download Source File |
Historical Data
| Date | Value |
|---|---|
| April 30, 2026 | 5.00% |
| March 31, 2026 | 5.00% |
| February 28, 2026 | 5.00% |
| January 31, 2026 | 5.00% |
| December 31, 2025 | 5.00% |
| November 30, 2025 | 5.00% |
| October 31, 2025 | |
| September 30, 2025 | 4.90% |
| August 31, 2025 | 4.90% |
| July 31, 2025 | 4.90% |
| June 30, 2025 | 5.00% |
| May 31, 2025 | 5.10% |
| April 30, 2025 | 5.20% |
| March 31, 2025 | 5.30% |
| February 28, 2025 | 5.30% |
| January 31, 2025 | 5.30% |
| December 31, 2024 | 5.30% |
| November 30, 2024 | 5.20% |
| October 31, 2024 | 5.10% |
| September 30, 2024 | 5.10% |
| August 31, 2024 | 5.00% |
| July 31, 2024 | 4.80% |
| June 30, 2024 | 4.70% |
| May 31, 2024 | 4.50% |
| April 30, 2024 | 4.40% |
| Date | Value |
|---|---|
| March 31, 2024 | 4.20% |
| February 29, 2024 | 4.00% |
| January 31, 2024 | 3.90% |
| December 31, 2023 | 4.00% |
| November 30, 2023 | 4.00% |
| October 31, 2023 | 4.00% |
| September 30, 2023 | 4.00% |
| August 31, 2023 | 4.00% |
| July 31, 2023 | 3.90% |
| June 30, 2023 | 3.80% |
| May 31, 2023 | 3.70% |
| April 30, 2023 | 3.70% |
| March 31, 2023 | 3.80% |
| February 28, 2023 | 3.90% |
| January 31, 2023 | 4.00% |
| December 31, 2022 | 4.10% |
| November 30, 2022 | 4.20% |
| October 31, 2022 | 4.20% |
| September 30, 2022 | 4.10% |
| August 31, 2022 | 4.00% |
| July 31, 2022 | 4.00% |
| June 30, 2022 | 4.00% |
| May 31, 2022 | 4.00% |
| April 30, 2022 | 4.10% |
| March 31, 2022 | 4.20% |
News
Headline
Time (ET)
06/05 09:13
06/01 07:10
05/29 08:15
05/25 09:56
Basic Info
|
Michigan Unemployment Rate is at 5.00%, compared to 5.00% last month and 5.20% last year. This is lower than the long term average of 7.58%. |
| Report | Regional and State Employment and Unemployment |
| Categories | Employment , Hours and Wages |
| Region | Michigan |
| Source | Bureau of Labor Statistics |
Stats
| Last Value | 5.00% |
| Latest Period | Apr 2026 |
| Last Updated | May 22 2026, 10:31 EDT |
| Next Release | Jun 23 2026, 10:30 EDT |
| Long Term Average | 7.58% |
| Average Growth Rate | 5.51% |
| Value from Last Month | 5.00% |
| Change from Last Month | 0.00% |
| Value from 1 Year Ago | 5.20% |
| Change from 1 Year Ago | -3.85% |
| Frequency | Monthly |
| Unit | Percent |
| Adjustment | Seasonally Adjusted |
| Download Source File |
Related Indicators
| State Unemployment Rates |
| California Unemployment Rate | 5.30% |
| Florida Unemployment Rate | 4.80% |
| Georgia Unemployment Rate | 3.50% |
| Illinois Unemployment Rate | 5.10% |
| New York Unemployment Rate | 4.60% |
| North Carolina Unemployment Rate | 3.70% |
| Ohio Unemployment Rate | 3.90% |
| Pennsylvania Unemployment Rate | 4.20% |
| Texas Unemployment Rate | 4.30% |