

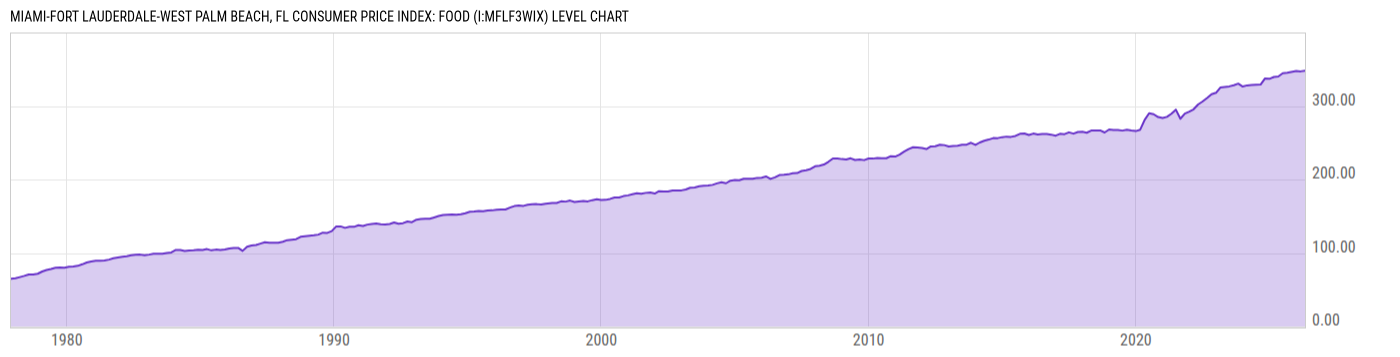
Miami-Fort Lauderdale-West Palm Beach, FL Consumer Price Index: Food (I:MFLF3WIX)
348.08 for Apr 2026
Level Chart
Basic Info
|
Miami-Fort Lauderdale-West Palm Beach, FL Consumer Price Index: Food is at a current level of 348.08, up from 347.10 two months ago and up from 340.17 one year ago. This is a change of 0.28% from two months ago and 2.33% from one year ago. |
| Report | Consumer Price Index |
| Category | Consumer Prices |
| Region | N/A |
| Source | Bureau of Labor Statistics |
Stats
| Last Value | 348.08 |
| Latest Period | Apr 2026 |
| Last Updated | May 15 2026, 18:20 EDT |
| Next Release | Jul 14 2026, 08:30 EDT |
| Average Growth Rate | 3.52% |
| Value from Two Months Ago | 347.10 |
| Change from Two Months Ago | 0.28% |
| Value from 1 Year Ago | 340.17 |
| Change from 1 Year Ago | 2.33% |
| Frequency | Bimonthly |
| Unit | Index 1982-84=100 |
| Adjustment | Not Seasonally Adjusted |
| Download Source File |
Historical Data
| Date | Value |
|---|---|
| April 30, 2026 | 348.08 |
| February 28, 2026 | 347.10 |
| December 31, 2025 | 347.60 |
| August 31, 2025 | 345.11 |
| June 30, 2025 | 344.59 |
| April 30, 2025 | 340.17 |
| February 28, 2025 | 339.43 |
| December 31, 2024 | 336.91 |
| October 31, 2024 | 337.51 |
| August 31, 2024 | 329.17 |
| June 30, 2024 | 328.88 |
| April 30, 2024 | 328.41 |
| February 29, 2024 | 328.05 |
| December 31, 2023 | 326.49 |
| October 31, 2023 | 330.37 |
| August 31, 2023 | 328.22 |
| June 30, 2023 | 326.69 |
| April 30, 2023 | 325.91 |
| February 28, 2023 | 325.02 |
| December 31, 2022 | 317.96 |
| October 31, 2022 | 316.05 |
| August 31, 2022 | 310.92 |
| June 30, 2022 | 306.11 |
| April 30, 2022 | 302.02 |
| February 28, 2022 | 295.54 |
| Date | Value |
|---|---|
| December 31, 2021 | 292.34 |
| October 31, 2021 | 289.56 |
| August 31, 2021 | 282.66 |
| June 30, 2021 | 295.02 |
| April 30, 2021 | 289.40 |
| February 28, 2021 | 285.19 |
| December 31, 2020 | 283.59 |
| October 31, 2020 | 284.90 |
| August 31, 2020 | 288.74 |
| June 30, 2020 | 290.08 |
| April 30, 2020 | 281.12 |
| February 29, 2020 | 267.79 |
| December 31, 2019 | 265.87 |
| October 31, 2019 | 266.58 |
| August 31, 2019 | 267.58 |
| June 30, 2019 | 266.51 |
| April 30, 2019 | 267.49 |
| February 28, 2019 | 267.44 |
| December 31, 2018 | 268.01 |
| October 31, 2018 | 263.98 |
| August 31, 2018 | 266.84 |
| June 30, 2018 | 266.81 |
| April 30, 2018 | 266.56 |
| February 28, 2018 | 263.62 |
| December 31, 2017 | 264.86 |
News
Headline
Time (ET)
05/22 09:11
05/19 11:40
05/19 07:30
Basic Info
|
Miami-Fort Lauderdale-West Palm Beach, FL Consumer Price Index: Food is at a current level of 348.08, up from 347.10 two months ago and up from 340.17 one year ago. This is a change of 0.28% from two months ago and 2.33% from one year ago. |
| Report | Consumer Price Index |
| Category | Consumer Prices |
| Region | N/A |
| Source | Bureau of Labor Statistics |
Stats
| Last Value | 348.08 |
| Latest Period | Apr 2026 |
| Last Updated | May 15 2026, 18:20 EDT |
| Next Release | Jul 14 2026, 08:30 EDT |
| Average Growth Rate | 3.52% |
| Value from Two Months Ago | 347.10 |
| Change from Two Months Ago | 0.28% |
| Value from 1 Year Ago | 340.17 |
| Change from 1 Year Ago | 2.33% |
| Frequency | Bimonthly |
| Unit | Index 1982-84=100 |
| Adjustment | Not Seasonally Adjusted |
| Download Source File |