

Metals & Minerals Price Index (I:MMPI)
Level Chart
Basic Info
|
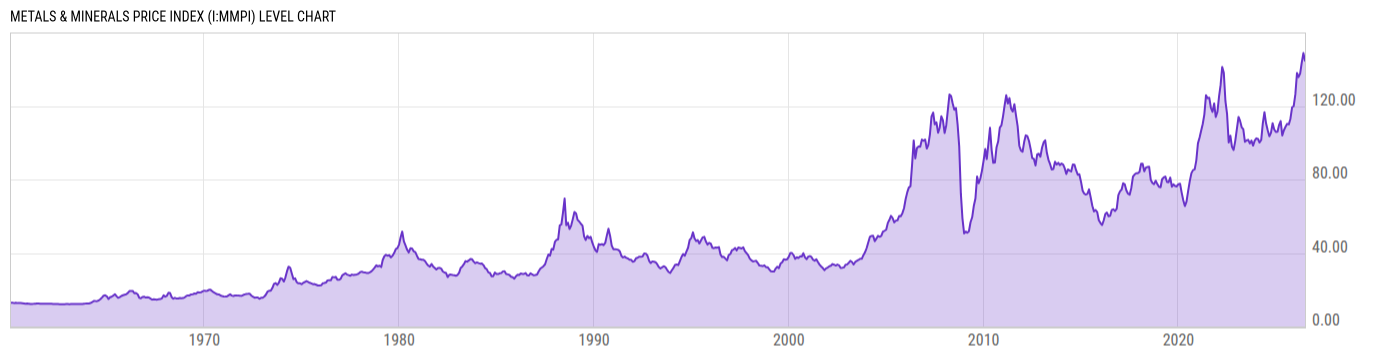
Metals & Minerals Price Index is at a current level of 144.60, down from 148.80 last month and up from 108.70 one year ago. This is a change of -2.82% from last month and 33.03% from one year ago. |
|
The Metals & Minerals Price Index is an indicator used to analyze metal prices. This indexed indicator is a weighted average of aluminum, copper, irone ore, lead, nickel, tin, and zinc prices. This commodity index reached a peak in 2008 during the recession. |
| Report | Commodity Markets Review |
| Categories | Agriculture and Livestock , Chemicals , Metals |
| Region | N/A |
| Source | World Bank |
Stats
| Last Value | 144.60 |
| Latest Period | Jun 2026 |
| Last Updated | Jul 6 2026, 11:00 EDT |
| Next Release | Aug 5 2026, 11:00 EDT (E) |
| Average Growth Rate | 4.83% |
| Value from Last Month | 148.80 |
| Change from Last Month | -2.82% |
| Value from 1 Year Ago | 108.70 |
| Change from 1 Year Ago | 33.03% |
| Frequency | Monthly |
| Unit | Index 2010=100 |
| Adjustment | N/A |
| Download Source File | |
| Notes | Weighted average of aluminum, copper, irone ore, lead, nickel, tin, and zinc prices. Based on current US dollars, 2010=100. |
Historical Data
| Date | Value |
|---|---|
| June 30, 2026 | 144.60 |
| May 31, 2026 | 148.80 |
| April 30, 2026 | 143.60 |
| March 31, 2026 | 137.60 |
| February 28, 2026 | 135.70 |
| January 31, 2026 | 138.00 |
| December 31, 2025 | 126.30 |
| November 30, 2025 | 119.90 |
| October 31, 2025 | 119.30 |
| September 30, 2025 | 113.10 |
| August 31, 2025 | 110.00 |
| July 31, 2025 | 110.30 |
| June 30, 2025 | 108.70 |
| May 31, 2025 | 106.80 |
| April 30, 2025 | 104.00 |
| March 31, 2025 | 111.80 |
| February 28, 2025 | 109.60 |
| January 31, 2025 | 106.00 |
| December 31, 2024 | 105.90 |
| November 30, 2024 | 107.20 |
| October 31, 2024 | 110.60 |
| September 30, 2024 | 105.40 |
| August 31, 2024 | 103.50 |
| July 31, 2024 | 106.80 |
| June 30, 2024 | 110.60 |
| Date | Value |
|---|---|
| May 31, 2024 | 116.64 |
| April 30, 2024 | 110.53 |
| March 31, 2024 | 101.47 |
| February 29, 2024 | 100.11 |
| January 31, 2024 | 102.03 |
| December 31, 2023 | 102.38 |
| November 30, 2023 | 101.16 |
| October 31, 2023 | 98.46 |
| September 30, 2023 | 101.16 |
| August 31, 2023 | 99.64 |
| July 31, 2023 | 101.59 |
| June 30, 2023 | 101.22 |
| May 31, 2023 | 100.52 |
| April 30, 2023 | 107.38 |
| March 31, 2023 | 108.40 |
| February 28, 2023 | 112.04 |
| January 31, 2023 | 114.01 |
| December 31, 2022 | 107.60 |
| November 30, 2022 | 100.92 |
| October 31, 2022 | 96.09 |
| September 30, 2022 | 97.77 |
| August 31, 2022 | 103.81 |
| July 31, 2022 | 100.15 |
| June 30, 2022 | 115.70 |
| May 31, 2022 | 122.46 |
News
Basic Info
|
Metals & Minerals Price Index is at a current level of 144.60, down from 148.80 last month and up from 108.70 one year ago. This is a change of -2.82% from last month and 33.03% from one year ago. |
|
The Metals & Minerals Price Index is an indicator used to analyze metal prices. This indexed indicator is a weighted average of aluminum, copper, irone ore, lead, nickel, tin, and zinc prices. This commodity index reached a peak in 2008 during the recession. |
| Report | Commodity Markets Review |
| Categories | Agriculture and Livestock , Chemicals , Metals |
| Region | N/A |
| Source | World Bank |
Stats
| Last Value | 144.60 |
| Latest Period | Jun 2026 |
| Last Updated | Jul 6 2026, 11:00 EDT |
| Next Release | Aug 5 2026, 11:00 EDT (E) |
| Average Growth Rate | 4.83% |
| Value from Last Month | 148.80 |
| Change from Last Month | -2.82% |
| Value from 1 Year Ago | 108.70 |
| Change from 1 Year Ago | 33.03% |
| Frequency | Monthly |
| Unit | Index 2010=100 |
| Adjustment | N/A |
| Download Source File | |
| Notes | Weighted average of aluminum, copper, irone ore, lead, nickel, tin, and zinc prices. Based on current US dollars, 2010=100. |