

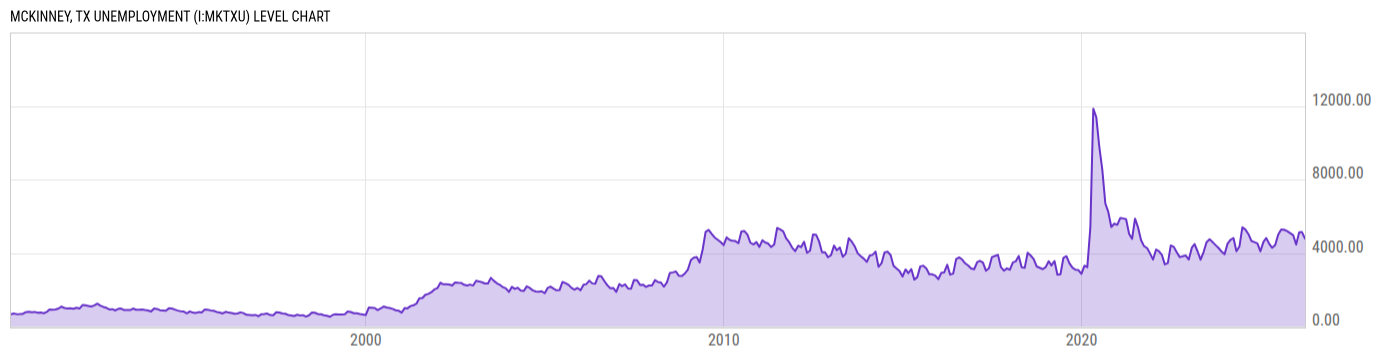
McKinney, TX Unemployment (I:MKTXU)
4784.00 for Mar 2026
Level Chart
Basic Info
|
McKinney, TX Unemployment is at a current level of 4784.00, down from 5137.00 last month and up from 4495.00 one year ago. This is a change of -6.87% from last month and 6.43% from one year ago. |
| Report | Metropolitan Area Employment and Unemployment |
| Categories | Employment , Hours and Wages |
| Region | N/A |
| Source | Bureau of Labor Statistics |
Stats
| Last Value | 4784.00 |
| Latest Period | Mar 2026 |
| Last Updated | May 22 2026, 18:56 EDT |
| Next Release | Jun 3 2026, 10:30 EDT |
| Average Growth Rate | 12.40% |
| Value from Last Month | 5137.00 |
| Change from Last Month | -6.87% |
| Value from 1 Year Ago | 4495.00 |
| Change from 1 Year Ago | 6.43% |
| Frequency | Monthly |
| Adjustment | Not Seasonally Adjusted |
| Download Source File |
Historical Data
| Date | Value |
|---|---|
| March 31, 2026 | 4784.00 |
| February 28, 2026 | 5137.00 |
| January 31, 2026 | 5136.00 |
| December 31, 2025 | 4464.00 |
| November 30, 2025 | 4977.00 |
| October 31, 2025 | |
| September 30, 2025 | 5191.00 |
| August 31, 2025 | 5266.00 |
| July 31, 2025 | 5274.00 |
| June 30, 2025 | 4995.00 |
| May 31, 2025 | 4433.00 |
| April 30, 2025 | 4283.00 |
| March 31, 2025 | 4495.00 |
| February 28, 2025 | 4819.00 |
| January 31, 2025 | 4605.00 |
| December 31, 2024 | 4094.00 |
| November 30, 2024 | 4524.00 |
| October 31, 2024 | 4589.00 |
| September 30, 2024 | 4655.00 |
| August 31, 2024 | 5023.00 |
| July 31, 2024 | 5274.00 |
| June 30, 2024 | 5403.00 |
| May 31, 2024 | 4358.00 |
| April 30, 2024 | 4095.00 |
| March 31, 2024 | 4815.00 |
| Date | Value |
|---|---|
| February 29, 2024 | 4711.00 |
| January 31, 2024 | 4511.00 |
| December 31, 2023 | 3933.00 |
| November 30, 2023 | 4080.00 |
| October 31, 2023 | 4272.00 |
| September 30, 2023 | 4428.00 |
| August 31, 2023 | 4595.00 |
| July 31, 2023 | 4744.00 |
| June 30, 2023 | 4584.00 |
| May 31, 2023 | 4052.00 |
| April 30, 2023 | 3636.00 |
| March 31, 2023 | 4082.00 |
| February 28, 2023 | 4481.00 |
| January 31, 2023 | 4287.00 |
| December 31, 2022 | 3643.00 |
| November 30, 2022 | 3859.00 |
| October 31, 2022 | 3826.00 |
| September 30, 2022 | 3775.00 |
| August 31, 2022 | 4025.00 |
| July 31, 2022 | 4333.00 |
| June 30, 2022 | 4411.00 |
| May 31, 2022 | 3450.00 |
| April 30, 2022 | 3381.00 |
| March 31, 2022 | 3902.00 |
| February 28, 2022 | 4100.00 |
News
Headline
Time (ET)
04/23 12:07
Basic Info
|
McKinney, TX Unemployment is at a current level of 4784.00, down from 5137.00 last month and up from 4495.00 one year ago. This is a change of -6.87% from last month and 6.43% from one year ago. |
| Report | Metropolitan Area Employment and Unemployment |
| Categories | Employment , Hours and Wages |
| Region | N/A |
| Source | Bureau of Labor Statistics |
Stats
| Last Value | 4784.00 |
| Latest Period | Mar 2026 |
| Last Updated | May 22 2026, 18:56 EDT |
| Next Release | Jun 3 2026, 10:30 EDT |
| Average Growth Rate | 12.40% |
| Value from Last Month | 5137.00 |
| Change from Last Month | -6.87% |
| Value from 1 Year Ago | 4495.00 |
| Change from 1 Year Ago | 6.43% |
| Frequency | Monthly |
| Adjustment | Not Seasonally Adjusted |
| Download Source File |