

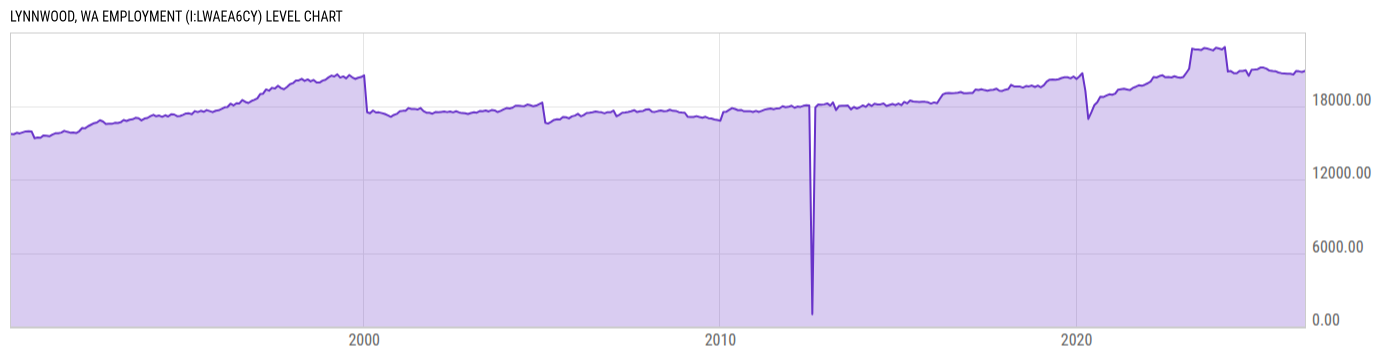
Lynnwood, WA Employment (I:LWAEA6CY)
20867.00 for May 2026
Level Chart
Basic Info
|
Lynnwood, WA Employment is at a current level of 20867.00, up from 20778.00 last month and down from 20895.00 one year ago. This is a change of 0.43% from last month and -0.13% from one year ago. |
| Report | Metropolitan Area Employment and Unemployment |
| Categories | Employment , Hours and Wages |
| Region | N/A |
| Source | Bureau of Labor Statistics |
Stats
| Last Value | 20867.00 |
| Latest Period | May 2026 |
| Last Updated | Jul 1 2026, 17:01 EDT |
| Next Release | Jul 29 2026, 10:30 EDT |
| Average Growth Rate | 44.52% |
| Value from Last Month | 20778.00 |
| Change from Last Month | 0.43% |
| Value from 1 Year Ago | 20895.00 |
| Change from 1 Year Ago | -0.13% |
| Frequency | Monthly |
| Adjustment | Not Seasonally Adjusted |
| Download Source File |
Historical Data
| Date | Value |
|---|---|
| May 31, 2026 | 20867.00 |
| April 30, 2026 | 20778.00 |
| March 31, 2026 | 20827.00 |
| February 28, 2026 | 20853.00 |
| January 31, 2026 | 20567.00 |
| December 31, 2025 | 20634.00 |
| November 30, 2025 | 20628.00 |
| October 31, 2025 | |
| September 30, 2025 | 20683.00 |
| August 31, 2025 | 20737.00 |
| July 31, 2025 | 20842.00 |
| June 30, 2025 | 20861.00 |
| May 31, 2025 | 20895.00 |
| April 30, 2025 | 21051.00 |
| March 31, 2025 | 21137.00 |
| February 28, 2025 | 21141.00 |
| January 31, 2025 | 21007.00 |
| December 31, 2024 | 20974.00 |
| November 30, 2024 | 20968.00 |
| October 31, 2024 | 20464.00 |
| September 30, 2024 | 20919.00 |
| August 31, 2024 | 20865.00 |
| July 31, 2024 | 20866.00 |
| June 30, 2024 | 20679.00 |
| May 31, 2024 | 20680.00 |
| Date | Value |
|---|---|
| April 30, 2024 | 20852.00 |
| March 31, 2024 | 20811.00 |
| February 29, 2024 | 22815.00 |
| January 31, 2024 | 22617.00 |
| December 31, 2023 | 22692.00 |
| November 30, 2023 | 22755.00 |
| October 31, 2023 | 22539.00 |
| September 30, 2023 | 22624.00 |
| August 31, 2023 | 22687.00 |
| July 31, 2023 | 22727.00 |
| June 30, 2023 | 22566.00 |
| May 31, 2023 | 22614.00 |
| April 30, 2023 | 22612.00 |
| March 31, 2023 | 22684.00 |
| February 28, 2023 | 21039.00 |
| January 31, 2023 | 20715.00 |
| December 31, 2022 | 20371.00 |
| November 30, 2022 | 20300.00 |
| October 31, 2022 | 20348.00 |
| September 30, 2022 | 20429.00 |
| August 31, 2022 | 20329.00 |
| July 31, 2022 | 20365.00 |
| June 30, 2022 | 20341.00 |
| May 31, 2022 | 20505.00 |
| April 30, 2022 | 20443.00 |
News
Headline
Time (ET)
07/13 09:06
07/10 08:58
07/02 16:13
Basic Info
|
Lynnwood, WA Employment is at a current level of 20867.00, up from 20778.00 last month and down from 20895.00 one year ago. This is a change of 0.43% from last month and -0.13% from one year ago. |
| Report | Metropolitan Area Employment and Unemployment |
| Categories | Employment , Hours and Wages |
| Region | N/A |
| Source | Bureau of Labor Statistics |
Stats
| Last Value | 20867.00 |
| Latest Period | May 2026 |
| Last Updated | Jul 1 2026, 17:01 EDT |
| Next Release | Jul 29 2026, 10:30 EDT |
| Average Growth Rate | 44.52% |
| Value from Last Month | 20778.00 |
| Change from Last Month | 0.43% |
| Value from 1 Year Ago | 20895.00 |
| Change from 1 Year Ago | -0.13% |
| Frequency | Monthly |
| Adjustment | Not Seasonally Adjusted |
| Download Source File |