

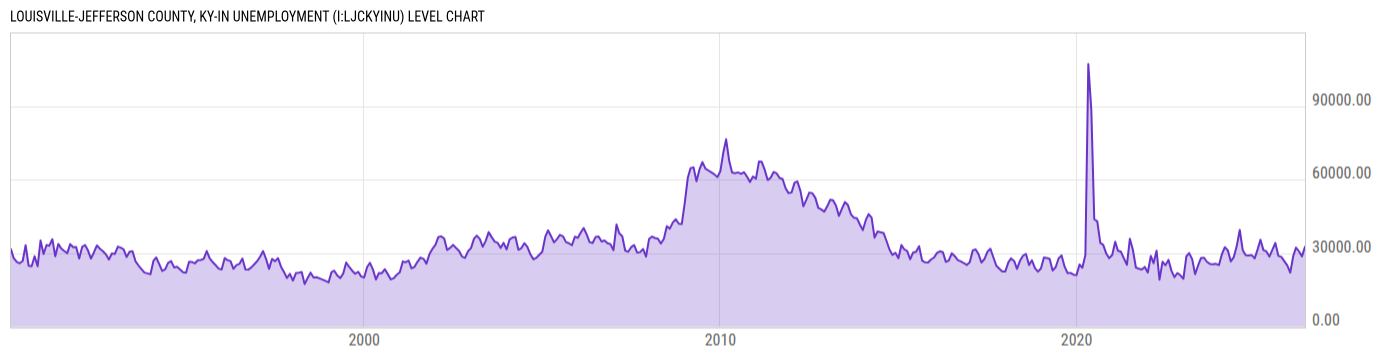
Louisville-Jefferson County, KY-IN Unemployment (I:LJCKYINU)
32571.00 for May 2026
Level Chart
Basic Info
|
Louisville-Jefferson County, KY-IN Unemployment is at a current level of 32571.00, up from 28620.00 last month and up from 28534.00 one year ago. This is a change of 13.81% from last month and 14.15% from one year ago. |
| Report | Metropolitan Area Employment and Unemployment |
| Categories | Employment , Hours and Wages |
| Region | N/A |
| Source | Bureau of Labor Statistics |
Stats
| Last Value | 32571.00 |
| Latest Period | May 2026 |
| Last Updated | Jul 1 2026, 17:01 EDT |
| Next Release | Jul 29 2026, 10:30 EDT |
| Average Growth Rate | 11.11% |
| Value from Last Month | 28620.00 |
| Change from Last Month | 13.81% |
| Value from 1 Year Ago | 28534.00 |
| Change from 1 Year Ago | 14.15% |
| Frequency | Monthly |
| Adjustment | Not Seasonally Adjusted |
| Download Source File | |
| Notes | Metropolitan Statistical Area. |
Historical Data
| Date | Value |
|---|---|
| May 31, 2026 | 32571.00 |
| April 30, 2026 | 28620.00 |
| March 31, 2026 | 30612.00 |
| February 28, 2026 | 32197.00 |
| January 31, 2026 | 28871.00 |
| December 31, 2025 | 21985.00 |
| November 30, 2025 | 24924.00 |
| October 31, 2025 | |
| September 30, 2025 | 28394.00 |
| August 31, 2025 | 28831.00 |
| July 31, 2025 | 34089.00 |
| June 30, 2025 | 31239.00 |
| May 31, 2025 | 28534.00 |
| April 30, 2025 | 30657.00 |
| March 31, 2025 | 31163.00 |
| February 28, 2025 | 35419.00 |
| January 31, 2025 | 31584.00 |
| December 31, 2024 | 27820.00 |
| November 30, 2024 | 29133.00 |
| October 31, 2024 | 28955.00 |
| September 30, 2024 | 29048.00 |
| August 31, 2024 | 31103.00 |
| July 31, 2024 | 39382.00 |
| June 30, 2024 | 32812.00 |
| May 31, 2024 | 28340.00 |
| Date | Value |
|---|---|
| April 30, 2024 | 26582.00 |
| March 31, 2024 | 31015.00 |
| February 29, 2024 | 32377.00 |
| January 31, 2024 | 29674.00 |
| December 31, 2023 | 25070.00 |
| November 30, 2023 | 25576.00 |
| October 31, 2023 | 25431.00 |
| September 30, 2023 | 25538.00 |
| August 31, 2023 | 26322.00 |
| July 31, 2023 | 28062.00 |
| June 30, 2023 | 27970.00 |
| May 31, 2023 | 24916.00 |
| April 30, 2023 | 21357.00 |
| March 31, 2023 | 27492.00 |
| February 28, 2023 | 29961.00 |
| January 31, 2023 | 28679.00 |
| December 31, 2022 | 19493.00 |
| November 30, 2022 | 20884.00 |
| October 31, 2022 | 21849.00 |
| September 30, 2022 | 20122.00 |
| August 31, 2022 | 22700.00 |
| July 31, 2022 | 27192.00 |
| June 30, 2022 | 24994.00 |
| May 31, 2022 | 26452.00 |
| April 30, 2022 | 19129.00 |
News
Headline
Time (ET)
07/10 08:58
07/02 16:13
Basic Info
|
Louisville-Jefferson County, KY-IN Unemployment is at a current level of 32571.00, up from 28620.00 last month and up from 28534.00 one year ago. This is a change of 13.81% from last month and 14.15% from one year ago. |
| Report | Metropolitan Area Employment and Unemployment |
| Categories | Employment , Hours and Wages |
| Region | N/A |
| Source | Bureau of Labor Statistics |
Stats
| Last Value | 32571.00 |
| Latest Period | May 2026 |
| Last Updated | Jul 1 2026, 17:01 EDT |
| Next Release | Jul 29 2026, 10:30 EDT |
| Average Growth Rate | 11.11% |
| Value from Last Month | 28620.00 |
| Change from Last Month | 13.81% |
| Value from 1 Year Ago | 28534.00 |
| Change from 1 Year Ago | 14.15% |
| Frequency | Monthly |
| Adjustment | Not Seasonally Adjusted |
| Download Source File | |
| Notes | Metropolitan Statistical Area. |