

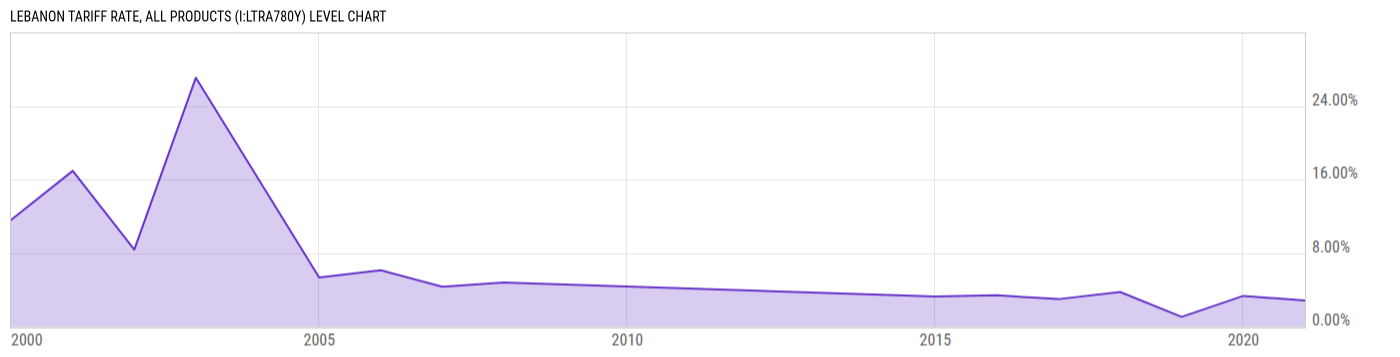
Lebanon Tariff Rate, All Products (I:LTRA780Y)
2.83% for 2020
Level Chart
Basic Info
|
Lebanon Tariff Rate, All Products is at 2.83%, compared to 3.33% last year. This is lower than the long term average of 7.01%. |
| Report | World Development Indicators |
| Categories | Employment , Governance and Policy , Governmental Statistics , Infrastructure , Public Health , Social |
| Region | Lebanon |
| Source | World Bank |
Stats
| Last Value | 2.83% |
| Latest Period | 2020 |
| Last Updated | Apr 16 2025, 19:14 EDT |
| Next Release | Jun 5 2026, 10:00 EDT (E) |
| Long Term Average | 7.01% |
| Average Growth Rate | 30.33% |
| Value from 1 Year Ago | 3.33% |
| Change from 1 Year Ago | -15.02% |
| Frequency | Yearly |
| Unit | Percent |
| Adjustment | Not Seasonally Adjusted |
| Download Source File | |
| Notes | Weighted mean applied tariff is the average of effectively applied rates weighted by the product import shares corresponding to each partner country. Data are classified using the Harmonized System of trade at the six- or eight-digit level. Tariff line data were matched to Standard International Trade Classification (SITC) revision 3 codes to define commodity groups and import weights. To the extent possible, specific rates have been converted to their ad valorem equivalent rates and have been included in the calculation of weighted mean tariffs. Import weights were calculated using the United Nations Statistics Division's Commodity Trade (Comtrade) database. Effectively applied tariff rates at the six- and eight-digit product level are averaged for products in each commodity group. When the effectively applied rate is unavailable, the most favored nation rate is used instead. |
Historical Data
| Date | Value |
|---|---|
| December 31, 2020 | 2.83% |
| December 31, 2019 | 3.33% |
| December 31, 2018 | 1.05% |
| December 31, 2017 | 3.76% |
| December 31, 2016 | 2.98% |
| December 31, 2015 | 3.39% |
| December 31, 2014 | 3.26% |
| December 31, 2013 | |
| December 31, 2012 | |
| December 31, 2011 | |
| December 31, 2010 |
| Date | Value |
|---|---|
| December 31, 2009 | |
| December 31, 2008 | |
| December 31, 2007 | 4.79% |
| December 31, 2006 | 4.32% |
| December 31, 2005 | 6.13% |
| December 31, 2004 | 5.33% |
| December 31, 2003 | |
| December 31, 2002 | 27.08% |
| December 31, 2001 | 8.36% |
| December 31, 2000 | 16.94% |
| December 31, 1999 | 11.59% |
News
Headline
Time (ET)
05/14 16:30
05/12 23:33
05/08 11:17
05/05 07:10
Basic Info
|
Lebanon Tariff Rate, All Products is at 2.83%, compared to 3.33% last year. This is lower than the long term average of 7.01%. |
| Report | World Development Indicators |
| Categories | Employment , Governance and Policy , Governmental Statistics , Infrastructure , Public Health , Social |
| Region | Lebanon |
| Source | World Bank |
Stats
| Last Value | 2.83% |
| Latest Period | 2020 |
| Last Updated | Apr 16 2025, 19:14 EDT |
| Next Release | Jun 5 2026, 10:00 EDT (E) |
| Long Term Average | 7.01% |
| Average Growth Rate | 30.33% |
| Value from 1 Year Ago | 3.33% |
| Change from 1 Year Ago | -15.02% |
| Frequency | Yearly |
| Unit | Percent |
| Adjustment | Not Seasonally Adjusted |
| Download Source File | |
| Notes | Weighted mean applied tariff is the average of effectively applied rates weighted by the product import shares corresponding to each partner country. Data are classified using the Harmonized System of trade at the six- or eight-digit level. Tariff line data were matched to Standard International Trade Classification (SITC) revision 3 codes to define commodity groups and import weights. To the extent possible, specific rates have been converted to their ad valorem equivalent rates and have been included in the calculation of weighted mean tariffs. Import weights were calculated using the United Nations Statistics Division's Commodity Trade (Comtrade) database. Effectively applied tariff rates at the six- and eight-digit product level are averaged for products in each commodity group. When the effectively applied rate is unavailable, the most favored nation rate is used instead. |