

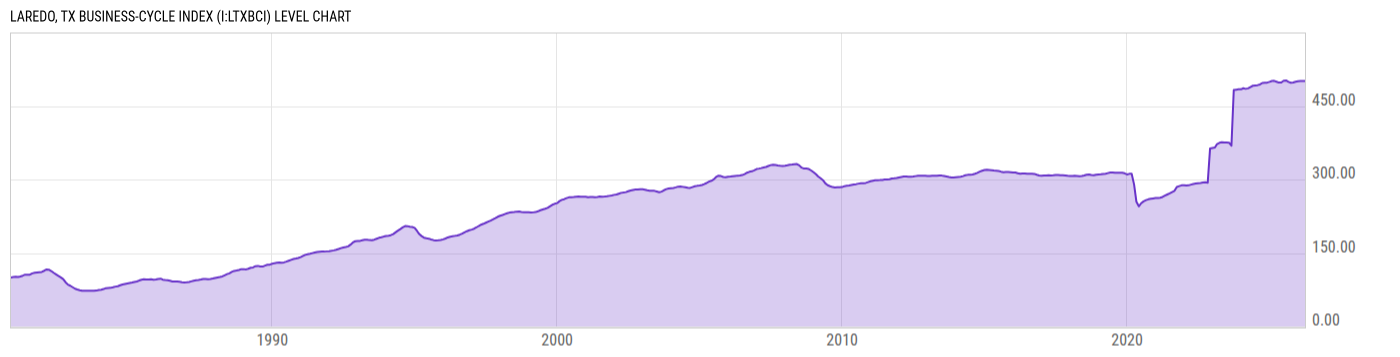
Laredo, TX Business-Cycle Index (I:LTXBCI)
501.20 for Mar 2026
Level Chart
Basic Info
|
Laredo, TX Business-Cycle Index is at a current level of 501.20, up from 500.91 last month and up from 499.59 one year ago. This is a change of 0.06% from last month and 0.32% from one year ago. |
| Report | Texas Business-Cycle Indexes |
| Category | Economic Sentiment, Outlook and Activity |
| Region | Texas |
| Source | Federal Reserve Bank of Dallas |
Stats
| Last Value | 501.20 |
| Latest Period | Mar 2026 |
| Last Updated | May 22 2026, 10:05 EDT |
| Next Release | Jun 19 2026, 10:00 EDT (E) |
| Average Growth Rate | 3.77% |
| Value from Last Month | 500.91 |
| Change from Last Month | 0.06% |
| Value from 1 Year Ago | 499.59 |
| Change from 1 Year Ago | 0.32% |
| Frequency | Monthly |
| Unit | Index October 1980=100 |
| Adjustment | N/A |
| Download Source File |
Historical Data
| Date | Value |
|---|---|
| March 31, 2026 | 501.20 |
| February 28, 2026 | 500.91 |
| January 31, 2026 | 500.81 |
| December 31, 2025 | 500.36 |
| November 30, 2025 | 499.46 |
| October 31, 2025 | 497.95 |
| September 30, 2025 | 497.52 |
| August 31, 2025 | 499.20 |
| July 31, 2025 | 502.09 |
| June 30, 2025 | 501.59 |
| May 31, 2025 | 498.09 |
| April 30, 2025 | 497.74 |
| March 31, 2025 | 499.59 |
| February 28, 2025 | 501.34 |
| January 31, 2025 | 500.97 |
| December 31, 2024 | 499.20 |
| November 30, 2024 | 497.63 |
| October 31, 2024 | 497.66 |
| September 30, 2024 | 496.90 |
| August 31, 2024 | 494.01 |
| July 31, 2024 | 492.54 |
| June 30, 2024 | 491.95 |
| May 31, 2024 | 491.32 |
| April 30, 2024 | 488.71 |
| March 31, 2024 | 485.93 |
| Date | Value |
|---|---|
| February 29, 2024 | 484.96 |
| January 31, 2024 | 486.27 |
| December 31, 2023 | 483.93 |
| November 30, 2023 | 483.96 |
| October 31, 2023 | 483.37 |
| September 30, 2023 | 482.59 |
| August 31, 2023 | 368.88 |
| July 31, 2023 | 375.11 |
| June 30, 2023 | 375.37 |
| May 31, 2023 | 375.58 |
| April 30, 2023 | 376.20 |
| March 31, 2023 | 374.87 |
| February 28, 2023 | 372.36 |
| January 31, 2023 | 365.36 |
| December 31, 2022 | 364.41 |
| November 30, 2022 | 363.15 |
| October 31, 2022 | 293.56 |
| September 30, 2022 | 294.20 |
| August 31, 2022 | 293.75 |
| July 31, 2022 | 292.94 |
| June 30, 2022 | 292.40 |
| May 31, 2022 | 291.82 |
| April 30, 2022 | 290.98 |
| March 31, 2022 | 289.58 |
| February 28, 2022 | 288.04 |
News
Headline
Time (ET)
05/13 15:57
05/01 16:52
04/30 13:32
04/30 09:10
04/23 08:36
Basic Info
|
Laredo, TX Business-Cycle Index is at a current level of 501.20, up from 500.91 last month and up from 499.59 one year ago. This is a change of 0.06% from last month and 0.32% from one year ago. |
| Report | Texas Business-Cycle Indexes |
| Category | Economic Sentiment, Outlook and Activity |
| Region | Texas |
| Source | Federal Reserve Bank of Dallas |
Stats
| Last Value | 501.20 |
| Latest Period | Mar 2026 |
| Last Updated | May 22 2026, 10:05 EDT |
| Next Release | Jun 19 2026, 10:00 EDT (E) |
| Average Growth Rate | 3.77% |
| Value from Last Month | 500.91 |
| Change from Last Month | 0.06% |
| Value from 1 Year Ago | 499.59 |
| Change from 1 Year Ago | 0.32% |
| Frequency | Monthly |
| Unit | Index October 1980=100 |
| Adjustment | N/A |
| Download Source File |