

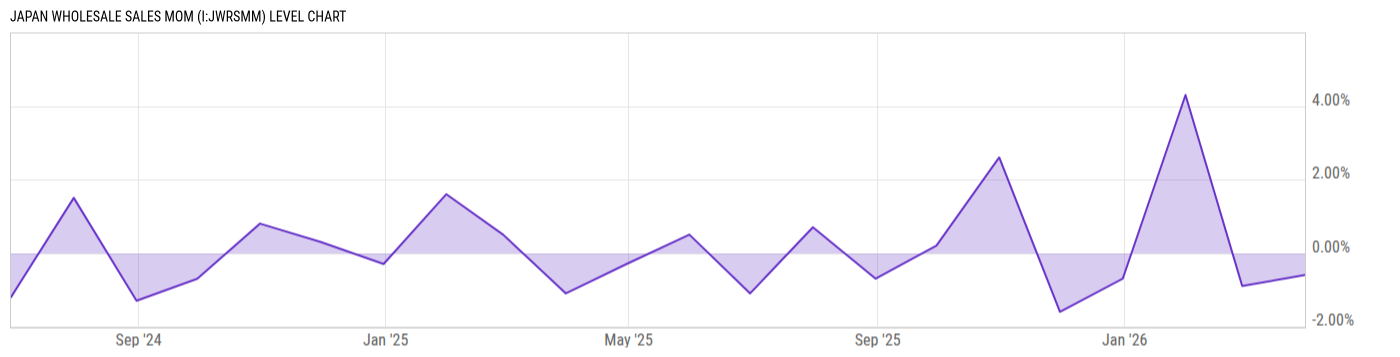
Japan Wholesale Sales MoM (I:JWRSMM)
-0.60% for Mar 2026
Level Chart
Basic Info
|
Japan Wholesale Sales MoM is at -0.60%, compared to -0.90% last month and 0.50% last year. This is lower than the long term average of 0.13%. |
|
CY 2020=100 |
Stats
| Last Value | -0.60% |
| Latest Period | Mar 2026 |
| Last Updated | Apr 30 2026, 10:31 EDT |
| Next Release | May 18 2026, 21:30 EDT (R) |
| Long Term Average | 0.13% |
| Average Growth Rate | -1.78K% |
| Value from Last Month | -0.90% |
| Change from Last Month | N/A |
| Value from 1 Year Ago | 0.50% |
| Change from 1 Year Ago | N/A |
| Frequency | Monthly |
| Unit | Percent |
| Adjustment | Seasonally Adjusted |
| Download Source File |
Historical Data
| Date | Value |
|---|---|
| March 31, 2026 | -0.60% |
| February 28, 2026 | -0.90% |
| January 31, 2026 | 4.30% |
| December 31, 2025 | -0.70% |
| November 30, 2025 | -1.60% |
| October 31, 2025 | 2.60% |
| September 30, 2025 | 0.20% |
| August 31, 2025 | -0.70% |
| July 31, 2025 | 0.70% |
| June 30, 2025 | -1.10% |
| May 31, 2025 | 0.50% |
| Date | Value |
|---|---|
| April 30, 2025 | -0.30% |
| March 31, 2025 | -1.10% |
| February 28, 2025 | 0.50% |
| January 31, 2025 | 1.60% |
| December 31, 2024 | -0.30% |
| November 30, 2024 | 0.30% |
| October 31, 2024 | 0.80% |
| September 30, 2024 | -0.70% |
| August 31, 2024 | -1.30% |
| July 31, 2024 | 1.50% |
| June 30, 2024 | -1.20% |
News
Headline
Time (ET)
05/15 13:45
04/24 08:58
04/23 08:36
Basic Info
|
Japan Wholesale Sales MoM is at -0.60%, compared to -0.90% last month and 0.50% last year. This is lower than the long term average of 0.13%. |
|
CY 2020=100 |
Stats
| Last Value | -0.60% |
| Latest Period | Mar 2026 |
| Last Updated | Apr 30 2026, 10:31 EDT |
| Next Release | May 18 2026, 21:30 EDT (R) |
| Long Term Average | 0.13% |
| Average Growth Rate | -1.78K% |
| Value from Last Month | -0.90% |
| Change from Last Month | N/A |
| Value from 1 Year Ago | 0.50% |
| Change from 1 Year Ago | N/A |
| Frequency | Monthly |
| Unit | Percent |
| Adjustment | Seasonally Adjusted |
| Download Source File |