

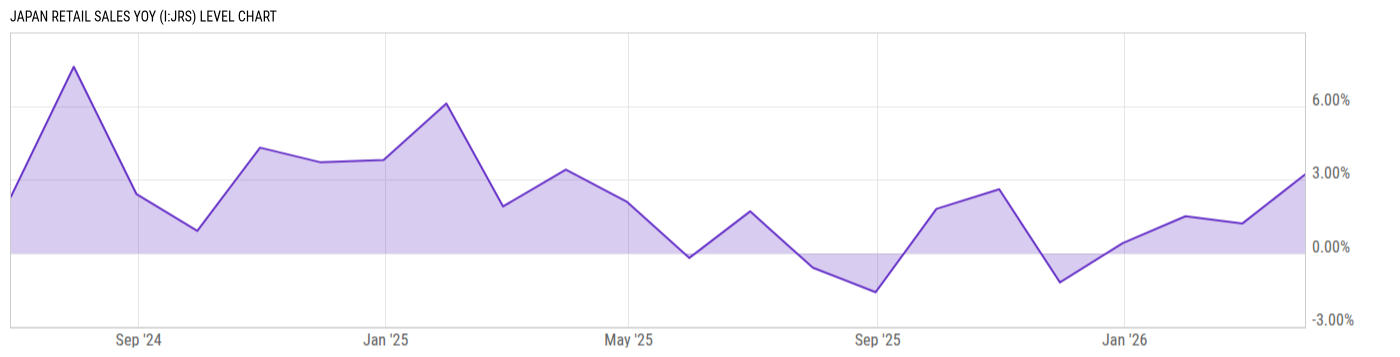
Japan Retail Sales YoY (I:JRS)
5.40% for Apr 2026
Level Chart
Basic Info
|
Japan Retail Sales YoY is at 5.40%, compared to 2.90% last month and 2.10% last year. This is higher than the long term average of 2.28%. |
|
None |
Stats
| Last Value | 5.40% |
| Latest Period | Apr 2026 |
| Last Updated | May 29 2026, 10:03 EDT |
| Next Release | Jun 11 2026, 21:30 EDT (R) |
| Long Term Average | 2.28% |
| Average Growth Rate | -269.7% |
| Value from Last Month | 2.90% |
| Change from Last Month | 86.21% |
| Value from 1 Year Ago | 2.10% |
| Change from 1 Year Ago | 157.1% |
| Frequency | Monthly |
| Unit | Percent |
| Adjustment | N/A |
| Download Source File |
Historical Data
| Date | Value |
|---|---|
| April 30, 2026 | 5.40% |
| March 31, 2026 | 2.90% |
| February 28, 2026 | 1.20% |
| January 31, 2026 | 1.50% |
| December 31, 2025 | 0.40% |
| November 30, 2025 | -1.20% |
| October 31, 2025 | 2.60% |
| September 30, 2025 | 1.80% |
| August 31, 2025 | -1.60% |
| July 31, 2025 | -0.60% |
| June 30, 2025 | 1.70% |
| May 31, 2025 | -0.20% |
| Date | Value |
|---|---|
| April 30, 2025 | 2.10% |
| March 31, 2025 | 3.40% |
| February 28, 2025 | 1.90% |
| January 31, 2025 | 6.10% |
| December 31, 2024 | 3.80% |
| November 30, 2024 | 3.70% |
| October 31, 2024 | 4.30% |
| September 30, 2024 | 0.90% |
| August 31, 2024 | 2.40% |
| July 31, 2024 | 7.60% |
| June 30, 2024 | 2.30% |
News
Headline
Time (ET)
05/27 17:35
05/25 08:54
05/22 09:40
05/22 08:46
Basic Info
|
Japan Retail Sales YoY is at 5.40%, compared to 2.90% last month and 2.10% last year. This is higher than the long term average of 2.28%. |
|
None |
Stats
| Last Value | 5.40% |
| Latest Period | Apr 2026 |
| Last Updated | May 29 2026, 10:03 EDT |
| Next Release | Jun 11 2026, 21:30 EDT (R) |
| Long Term Average | 2.28% |
| Average Growth Rate | -269.7% |
| Value from Last Month | 2.90% |
| Change from Last Month | 86.21% |
| Value from 1 Year Ago | 2.10% |
| Change from 1 Year Ago | 157.1% |
| Frequency | Monthly |
| Unit | Percent |
| Adjustment | N/A |
| Download Source File |