

US Investor Sentiment, % Bullish (I:USISBNW)
Level Chart
Basic Info
|
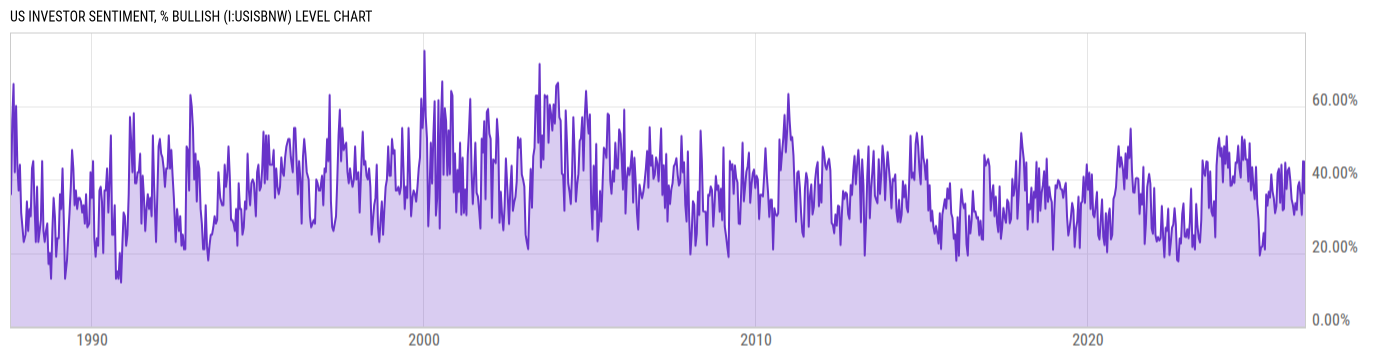
US Investor Sentiment, % Bullish is at 44.91%, compared to 36.28% last week and 41.38% last year. This is higher than the long term average of 37.61%. |
|
US Investor Sentiment, % Bullish is an indicator that is a part of the AAII Sentiment Survey. It indicates the percentage of investors surveyed that had a bullish outlook on the market. An investor that is bullish, will primarily think that the market will head higher in the next six months. One of the highs of the bullish survey was in 2000 during the technology boom. This sentiment indicator reached 75% during that time frame. |
| Report | AAII Sentiment Survey |
| Category | Market Indices and Statistics |
Stats
| Last Value | 44.91% |
| Latest Period | Jul 16 2026 |
| Last Updated | Jul 20 2026, 08:09 EDT |
| Next Release | Jul 23 2026, 12:00 EDT |
| Long Term Average | 37.61% |
| Average Growth Rate | 117.7% |
| Value from Last Week | 36.28% |
| Change from Last Week | 23.78% |
| Value from 1 Year Ago | 41.38% |
| Change from 1 Year Ago | 8.53% |
| Frequency | Weekly |
| Unit | Percent |
| Adjustment | N/A |
| Download Source File |
Historical Data
| Date | Value |
|---|---|
| July 16, 2026 | 44.91% |
| July 09, 2026 | 36.28% |
| July 02, 2026 | 31.36% |
| June 25, 2026 | 44.93% |
| June 18, 2026 | 36.57% |
| June 11, 2026 | 30.37% |
| June 04, 2026 | 36.26% |
| May 28, 2026 | 35.56% |
| May 21, 2026 | 31.72% |
| May 14, 2026 | 39.32% |
| May 07, 2026 | 38.31% |
| April 30, 2026 | 38.13% |
| April 23, 2026 | 46.05% |
| April 16, 2026 | 31.73% |
| April 09, 2026 | 35.75% |
| April 02, 2026 | 33.57% |
| March 26, 2026 | 32.10% |
| March 19, 2026 | 30.40% |
| March 12, 2026 | 31.94% |
| March 05, 2026 | 33.06% |
| February 26, 2026 | 33.20% |
| February 19, 2026 | 34.54% |
| February 12, 2026 | 38.52% |
| February 05, 2026 | 39.67% |
| January 29, 2026 | 44.40% |
| Date | Value |
|---|---|
| January 22, 2026 | 43.17% |
| January 15, 2026 | 49.50% |
| January 08, 2026 | 42.49% |
| January 01, 2026 | 42.04% |
| December 25, 2025 | 37.44% |
| December 18, 2025 | 44.14% |
| December 11, 2025 | 44.59% |
| December 04, 2025 | 44.29% |
| November 27, 2025 | 32.03% |
| November 20, 2025 | 32.58% |
| November 13, 2025 | 31.62% |
| November 06, 2025 | 37.97% |
| October 30, 2025 | 44.03% |
| October 23, 2025 | 36.86% |
| October 16, 2025 | 33.66% |
| October 09, 2025 | 45.87% |
| October 02, 2025 | 42.92% |
| September 25, 2025 | 41.73% |
| September 18, 2025 | 41.67% |
| September 11, 2025 | 28.03% |
| September 04, 2025 | 32.69% |
| August 28, 2025 | 34.60% |
| August 21, 2025 | 30.84% |
| August 14, 2025 | 29.88% |
| August 07, 2025 | 34.87% |
News
Basic Info
|
US Investor Sentiment, % Bullish is at 44.91%, compared to 36.28% last week and 41.38% last year. This is higher than the long term average of 37.61%. |
|
US Investor Sentiment, % Bullish is an indicator that is a part of the AAII Sentiment Survey. It indicates the percentage of investors surveyed that had a bullish outlook on the market. An investor that is bullish, will primarily think that the market will head higher in the next six months. One of the highs of the bullish survey was in 2000 during the technology boom. This sentiment indicator reached 75% during that time frame. |
| Report | AAII Sentiment Survey |
| Category | Market Indices and Statistics |
Stats
| Last Value | 44.91% |
| Latest Period | Jul 16 2026 |
| Last Updated | Jul 20 2026, 08:09 EDT |
| Next Release | Jul 23 2026, 12:00 EDT |
| Long Term Average | 37.61% |
| Average Growth Rate | 117.7% |
| Value from Last Week | 36.28% |
| Change from Last Week | 23.78% |
| Value from 1 Year Ago | 41.38% |
| Change from 1 Year Ago | 8.53% |
| Frequency | Weekly |
| Unit | Percent |
| Adjustment | N/A |
| Download Source File |
Related Indicators
| US Economy |
| ADP Employment Change | 98000.00 |
| Effective Federal Funds Rate | 3.63% |
| US Durable Goods New Orders MoM | -4.48% |
| US Housing Starts MoM | 19.02% |
| US Imports MoM | 3.27% |
| US Index of Consumer Sentiment | 54.40 |
| US Inflation Rate | 3.50% |
| US Initial Claims for Unemployment Insurance | 208000.0 |
| US ISM Manufacturing PMI | 53.30 |
| US Real GDP QoQ | 2.10% |
| US Retail and Food Services Sales MoM | 0.22% |
| US Unemployment Rate | 4.20% |