

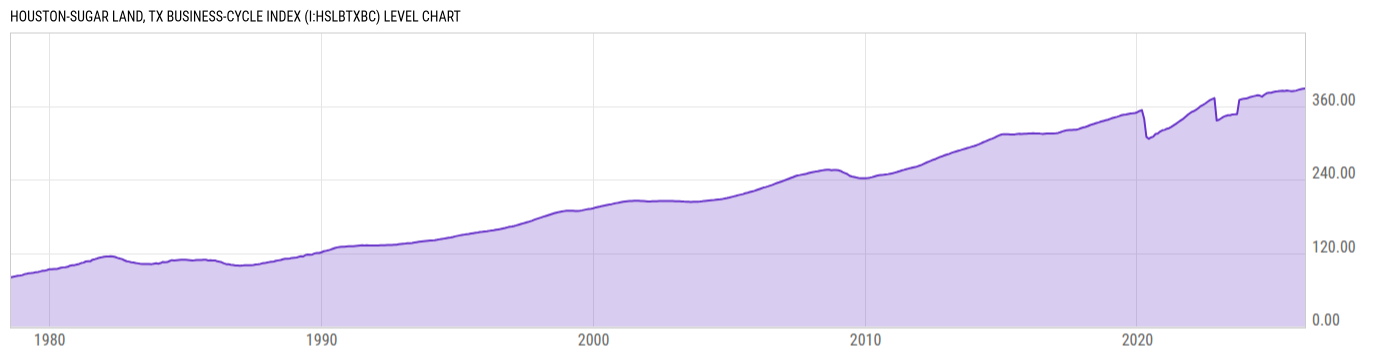
Houston-Sugar Land, TX Business-Cycle Index (I:HSLBTXBC)
388.50 for Feb 2026
Level Chart
Basic Info
|
Houston-Sugar Land, TX Business-Cycle Index is at a current level of 388.50, up from 388.04 last month and up from 383.97 one year ago. This is a change of 0.12% from last month and 1.18% from one year ago. |
| Report | Texas Business-Cycle Indexes |
| Category | Economic Sentiment, Outlook and Activity |
| Region | Texas |
| Source | Federal Reserve Bank of Dallas |
Stats
| Last Value | 388.50 |
| Latest Period | Feb 2026 |
| Last Updated | Apr 20 2026, 10:37 EDT |
| Next Release | May 22 2026, 10:00 EDT (E) |
| Average Growth Rate | 3.35% |
| Value from Last Month | 388.04 |
| Change from Last Month | 0.12% |
| Value from 1 Year Ago | 383.97 |
| Change from 1 Year Ago | 1.18% |
| Frequency | Monthly |
| Unit | Index October 1980=100 |
| Adjustment | N/A |
| Download Source File |
Historical Data
| Date | Value |
|---|---|
| February 28, 2026 | 388.50 |
| January 31, 2026 | 388.04 |
| December 31, 2025 | 387.43 |
| November 30, 2025 | 386.28 |
| October 31, 2025 | 385.11 |
| September 30, 2025 | 384.49 |
| August 31, 2025 | 383.96 |
| July 31, 2025 | 384.67 |
| June 30, 2025 | 385.30 |
| May 31, 2025 | 384.40 |
| April 30, 2025 | 384.83 |
| March 31, 2025 | 384.64 |
| February 28, 2025 | 383.97 |
| January 31, 2025 | 383.77 |
| December 31, 2024 | 382.74 |
| November 30, 2024 | 381.74 |
| October 31, 2024 | 381.52 |
| September 30, 2024 | 380.73 |
| August 31, 2024 | 378.30 |
| July 31, 2024 | 375.28 |
| June 30, 2024 | 376.96 |
| May 31, 2024 | 377.43 |
| April 30, 2024 | 376.53 |
| March 31, 2024 | 375.68 |
| February 29, 2024 | 374.80 |
| Date | Value |
|---|---|
| January 31, 2024 | 373.40 |
| December 31, 2023 | 372.08 |
| November 30, 2023 | 372.01 |
| October 31, 2023 | 371.15 |
| September 30, 2023 | 370.00 |
| August 31, 2023 | 346.68 |
| July 31, 2023 | 346.34 |
| June 30, 2023 | 346.28 |
| May 31, 2023 | 344.90 |
| April 30, 2023 | 344.87 |
| March 31, 2023 | 343.77 |
| February 28, 2023 | 342.17 |
| January 31, 2023 | 340.05 |
| December 31, 2022 | 337.60 |
| November 30, 2022 | 336.27 |
| October 31, 2022 | 372.89 |
| September 30, 2022 | 371.12 |
| August 31, 2022 | 369.48 |
| July 31, 2022 | 366.94 |
| June 30, 2022 | 364.11 |
| May 31, 2022 | 361.89 |
| April 30, 2022 | 359.90 |
| March 31, 2022 | 356.86 |
| February 28, 2022 | 354.00 |
| January 31, 2022 | 351.87 |
News
Headline
Time (ET)
05/13 15:57
04/30 13:32
04/30 09:10
04/23 08:36
Basic Info
|
Houston-Sugar Land, TX Business-Cycle Index is at a current level of 388.50, up from 388.04 last month and up from 383.97 one year ago. This is a change of 0.12% from last month and 1.18% from one year ago. |
| Report | Texas Business-Cycle Indexes |
| Category | Economic Sentiment, Outlook and Activity |
| Region | Texas |
| Source | Federal Reserve Bank of Dallas |
Stats
| Last Value | 388.50 |
| Latest Period | Feb 2026 |
| Last Updated | Apr 20 2026, 10:37 EDT |
| Next Release | May 22 2026, 10:00 EDT (E) |
| Average Growth Rate | 3.35% |
| Value from Last Month | 388.04 |
| Change from Last Month | 0.12% |
| Value from 1 Year Ago | 383.97 |
| Change from 1 Year Ago | 1.18% |
| Frequency | Monthly |
| Unit | Index October 1980=100 |
| Adjustment | N/A |
| Download Source File |