

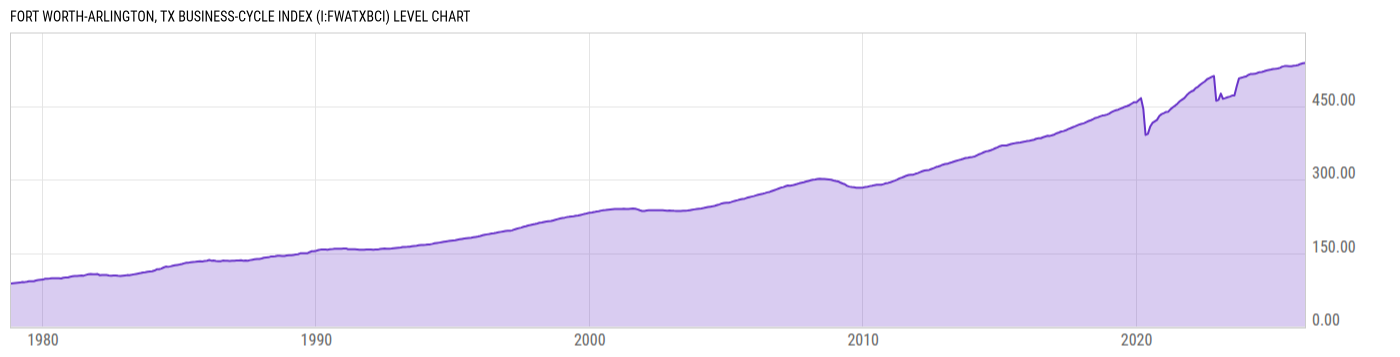
Fort Worth-Arlington, TX Business-Cycle Index (I:FWATXBCI)
537.77 for Feb 2026
Level Chart
Basic Info
|
Fort Worth-Arlington, TX Business-Cycle Index is at a current level of 537.77, up from 537.39 last month and up from 526.49 one year ago. This is a change of 0.07% from last month and 2.14% from one year ago. |
| Report | Texas Business-Cycle Indexes |
| Category | Economic Sentiment, Outlook and Activity |
| Region | Texas |
| Source | Federal Reserve Bank of Dallas |
Stats
| Last Value | 537.77 |
| Latest Period | Feb 2026 |
| Last Updated | Apr 20 2026, 10:37 EDT |
| Next Release | May 22 2026, 10:00 EDT (E) |
| Average Growth Rate | 3.89% |
| Value from Last Month | 537.39 |
| Change from Last Month | 0.07% |
| Value from 1 Year Ago | 526.49 |
| Change from 1 Year Ago | 2.14% |
| Frequency | Monthly |
| Unit | Index October 1980=100 |
| Adjustment | N/A |
| Download Source File |
Historical Data
| Date | Value |
|---|---|
| February 28, 2026 | 537.77 |
| January 31, 2026 | 537.39 |
| December 31, 2025 | 535.84 |
| November 30, 2025 | 533.68 |
| October 31, 2025 | 532.83 |
| September 30, 2025 | 532.19 |
| August 31, 2025 | 531.16 |
| July 31, 2025 | 530.95 |
| June 30, 2025 | 531.77 |
| May 31, 2025 | 531.42 |
| April 30, 2025 | 530.34 |
| March 31, 2025 | 527.81 |
| February 28, 2025 | 526.49 |
| January 31, 2025 | 525.88 |
| December 31, 2024 | 525.60 |
| November 30, 2024 | 524.36 |
| October 31, 2024 | 523.47 |
| September 30, 2024 | 522.44 |
| August 31, 2024 | 520.84 |
| July 31, 2024 | 519.46 |
| June 30, 2024 | 519.11 |
| May 31, 2024 | 517.26 |
| April 30, 2024 | 515.62 |
| March 31, 2024 | 515.46 |
| February 29, 2024 | 515.06 |
| Date | Value |
|---|---|
| January 31, 2024 | 513.34 |
| December 31, 2023 | 510.04 |
| November 30, 2023 | 508.98 |
| October 31, 2023 | 507.64 |
| September 30, 2023 | 506.34 |
| August 31, 2023 | 490.13 |
| July 31, 2023 | 471.20 |
| June 30, 2023 | 471.24 |
| May 31, 2023 | 469.16 |
| April 30, 2023 | 467.93 |
| March 31, 2023 | 466.11 |
| February 28, 2023 | 464.78 |
| January 31, 2023 | 475.25 |
| December 31, 2022 | 462.60 |
| November 30, 2022 | 460.79 |
| October 31, 2022 | 511.18 |
| September 30, 2022 | 509.52 |
| August 31, 2022 | 507.05 |
| July 31, 2022 | 504.57 |
| June 30, 2022 | 500.08 |
| May 31, 2022 | 497.02 |
| April 30, 2022 | 493.37 |
| March 31, 2022 | 489.09 |
| February 28, 2022 | 486.34 |
| January 31, 2022 | 481.60 |
News
Headline
Time (ET)
05/13 15:57
04/30 13:32
04/30 09:10
04/23 08:36
Basic Info
|
Fort Worth-Arlington, TX Business-Cycle Index is at a current level of 537.77, up from 537.39 last month and up from 526.49 one year ago. This is a change of 0.07% from last month and 2.14% from one year ago. |
| Report | Texas Business-Cycle Indexes |
| Category | Economic Sentiment, Outlook and Activity |
| Region | Texas |
| Source | Federal Reserve Bank of Dallas |
Stats
| Last Value | 537.77 |
| Latest Period | Feb 2026 |
| Last Updated | Apr 20 2026, 10:37 EDT |
| Next Release | May 22 2026, 10:00 EDT (E) |
| Average Growth Rate | 3.89% |
| Value from Last Month | 537.39 |
| Change from Last Month | 0.07% |
| Value from 1 Year Ago | 526.49 |
| Change from 1 Year Ago | 2.14% |
| Frequency | Monthly |
| Unit | Index October 1980=100 |
| Adjustment | N/A |
| Download Source File |