

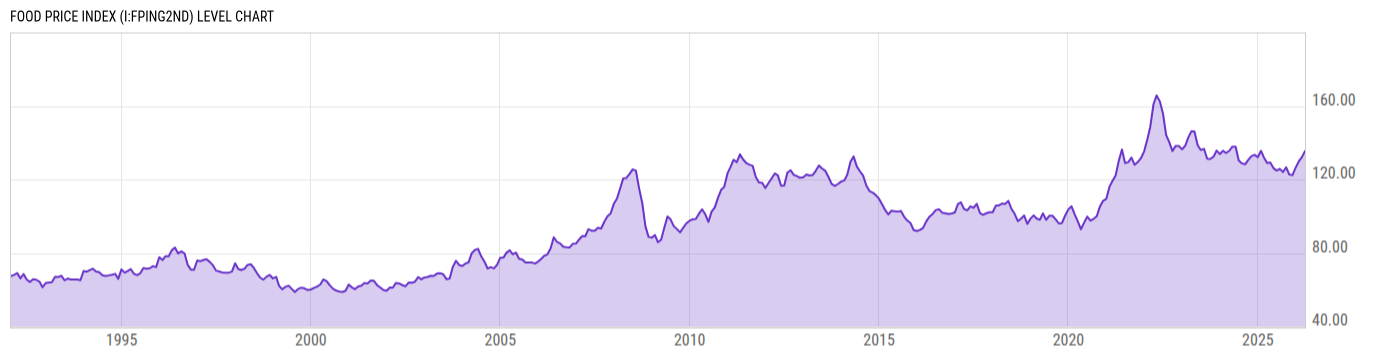
Food Price Index (I:FPING2ND)
135.46 for Mar 2026
Level Chart
Basic Info
|
Food Price Index is at a current level of 135.46, up from 132.06 last month and up from 128.98 one year ago. This is a change of 2.58% from last month and 5.03% from one year ago. |
| Report | IMF Primary Commodity Prices |
| Categories | Agriculture and Livestock , Chemicals , Metals |
| Region | N/A |
| Source | International Monetary Fund |
Stats
| Last Value | 135.46 |
| Latest Period | Mar 2026 |
| Last Updated | May 6 2026, 11:11 EDT |
| Next Release | Jun 3 2026, 08:00 EDT (E) |
| Average Growth Rate | 2.55% |
| Value from Last Month | 132.06 |
| Change from Last Month | 2.58% |
| Value from 1 Year Ago | 128.98 |
| Change from 1 Year Ago | 5.03% |
| Frequency | Monthly |
| Unit | Index 2016=100 |
| Adjustment | N/A |
| Download Source File |
Historical Data
| Date | Value |
|---|---|
| March 31, 2026 | 135.46 |
| February 28, 2026 | 132.06 |
| January 31, 2026 | 129.96 |
| December 31, 2025 | 126.47 |
| November 30, 2025 | 122.38 |
| October 31, 2025 | 122.68 |
| September 30, 2025 | 126.66 |
| August 31, 2025 | 124.08 |
| July 31, 2025 | 125.77 |
| June 30, 2025 | 124.84 |
| May 31, 2025 | 126.20 |
| April 30, 2025 | 129.21 |
| March 31, 2025 | 128.98 |
| February 28, 2025 | 132.02 |
| January 31, 2025 | 135.63 |
| December 31, 2024 | 132.20 |
| November 30, 2024 | 133.40 |
| October 31, 2024 | 132.74 |
| September 30, 2024 | 130.69 |
| August 31, 2024 | 128.27 |
| July 31, 2024 | 128.76 |
| June 30, 2024 | 130.30 |
| May 31, 2024 | 137.78 |
| April 30, 2024 | 137.86 |
| March 31, 2024 | 135.65 |
| Date | Value |
|---|---|
| February 29, 2024 | 134.39 |
| January 31, 2024 | 135.60 |
| December 31, 2023 | 133.88 |
| November 30, 2023 | 135.74 |
| October 31, 2023 | 132.42 |
| September 30, 2023 | 131.14 |
| August 31, 2023 | 131.30 |
| July 31, 2023 | 136.67 |
| June 30, 2023 | 136.07 |
| May 31, 2023 | 138.66 |
| April 30, 2023 | 146.14 |
| March 31, 2023 | 146.21 |
| February 28, 2023 | 142.63 |
| January 31, 2023 | 138.37 |
| December 31, 2022 | 136.42 |
| November 30, 2022 | 138.28 |
| October 31, 2022 | 138.28 |
| September 30, 2022 | 135.47 |
| August 31, 2022 | 140.24 |
| July 31, 2022 | 144.22 |
| June 30, 2022 | 156.11 |
| May 31, 2022 | 162.53 |
| April 30, 2022 | 165.75 |
| March 31, 2022 | 160.95 |
| February 28, 2022 | 148.72 |
News
Headline
Time (ET)
05/22 07:41
04/23 07:31
Basic Info
|
Food Price Index is at a current level of 135.46, up from 132.06 last month and up from 128.98 one year ago. This is a change of 2.58% from last month and 5.03% from one year ago. |
| Report | IMF Primary Commodity Prices |
| Categories | Agriculture and Livestock , Chemicals , Metals |
| Region | N/A |
| Source | International Monetary Fund |
Stats
| Last Value | 135.46 |
| Latest Period | Mar 2026 |
| Last Updated | May 6 2026, 11:11 EDT |
| Next Release | Jun 3 2026, 08:00 EDT (E) |
| Average Growth Rate | 2.55% |
| Value from Last Month | 132.06 |
| Change from Last Month | 2.58% |
| Value from 1 Year Ago | 128.98 |
| Change from 1 Year Ago | 5.03% |
| Frequency | Monthly |
| Unit | Index 2016=100 |
| Adjustment | N/A |
| Download Source File |