

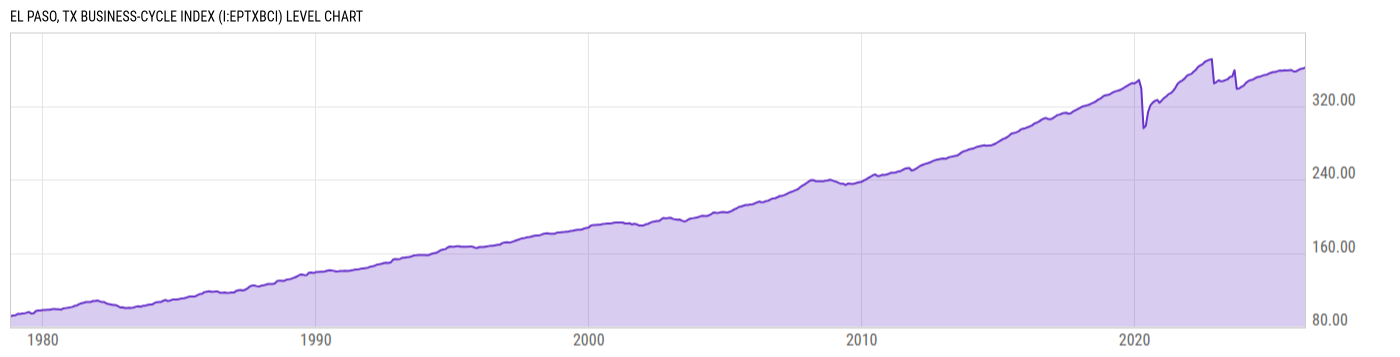
El Paso, TX Business-Cycle Index (I:EPTXBCI)
361.80 for Mar 2026
Level Chart
Basic Info
|
El Paso, TX Business-Cycle Index is at a current level of 361.80, up from 360.76 last month and up from 357.96 one year ago. This is a change of 0.29% from last month and 1.07% from one year ago. |
| Report | Texas Business-Cycle Indexes |
| Category | Economic Sentiment, Outlook and Activity |
| Region | Texas |
| Source | Federal Reserve Bank of Dallas |
Stats
| Last Value | 361.80 |
| Latest Period | Mar 2026 |
| Last Updated | May 22 2026, 10:05 EDT |
| Next Release | Jun 19 2026, 10:00 EDT (E) |
| Average Growth Rate | 2.95% |
| Value from Last Month | 360.76 |
| Change from Last Month | 0.29% |
| Value from 1 Year Ago | 357.96 |
| Change from 1 Year Ago | 1.07% |
| Frequency | Monthly |
| Unit | Index October 1980=100 |
| Adjustment | N/A |
| Download Source File |
Historical Data
| Date | Value |
|---|---|
| March 31, 2026 | 361.80 |
| February 28, 2026 | 360.76 |
| January 31, 2026 | 360.32 |
| December 31, 2025 | 359.01 |
| November 30, 2025 | 357.67 |
| October 31, 2025 | 357.54 |
| September 30, 2025 | 359.17 |
| August 31, 2025 | 358.88 |
| July 31, 2025 | 358.56 |
| June 30, 2025 | 358.83 |
| May 31, 2025 | 358.35 |
| April 30, 2025 | 358.61 |
| March 31, 2025 | 357.96 |
| February 28, 2025 | 357.08 |
| January 31, 2025 | 356.95 |
| December 31, 2024 | 356.16 |
| November 30, 2024 | 355.22 |
| October 31, 2024 | 353.88 |
| September 30, 2024 | 353.65 |
| August 31, 2024 | 352.73 |
| July 31, 2024 | 351.76 |
| June 30, 2024 | 351.51 |
| May 31, 2024 | 350.20 |
| April 30, 2024 | 348.65 |
| March 31, 2024 | 348.19 |
| Date | Value |
|---|---|
| February 29, 2024 | 346.99 |
| January 31, 2024 | 345.19 |
| December 31, 2023 | 342.28 |
| November 30, 2023 | 340.79 |
| October 31, 2023 | 339.05 |
| September 30, 2023 | 338.65 |
| August 31, 2023 | 358.95 |
| July 31, 2023 | 352.13 |
| June 30, 2023 | 351.61 |
| May 31, 2023 | 349.09 |
| April 30, 2023 | 348.20 |
| March 31, 2023 | 347.16 |
| February 28, 2023 | 346.82 |
| January 31, 2023 | 348.02 |
| December 31, 2022 | 346.05 |
| November 30, 2022 | 344.63 |
| October 31, 2022 | 371.03 |
| September 30, 2022 | 370.40 |
| August 31, 2022 | 369.33 |
| July 31, 2022 | 368.20 |
| June 30, 2022 | 365.56 |
| May 31, 2022 | 364.18 |
| April 30, 2022 | 362.55 |
| March 31, 2022 | 359.43 |
| February 28, 2022 | 357.35 |
News
Headline
Time (ET)
05/13 15:57
05/01 16:52
04/30 13:32
04/30 09:10
04/23 08:36
Basic Info
|
El Paso, TX Business-Cycle Index is at a current level of 361.80, up from 360.76 last month and up from 357.96 one year ago. This is a change of 0.29% from last month and 1.07% from one year ago. |
| Report | Texas Business-Cycle Indexes |
| Category | Economic Sentiment, Outlook and Activity |
| Region | Texas |
| Source | Federal Reserve Bank of Dallas |
Stats
| Last Value | 361.80 |
| Latest Period | Mar 2026 |
| Last Updated | May 22 2026, 10:05 EDT |
| Next Release | Jun 19 2026, 10:00 EDT (E) |
| Average Growth Rate | 2.95% |
| Value from Last Month | 360.76 |
| Change from Last Month | 0.29% |
| Value from 1 Year Ago | 357.96 |
| Change from 1 Year Ago | 1.07% |
| Frequency | Monthly |
| Unit | Index October 1980=100 |
| Adjustment | N/A |
| Download Source File |