

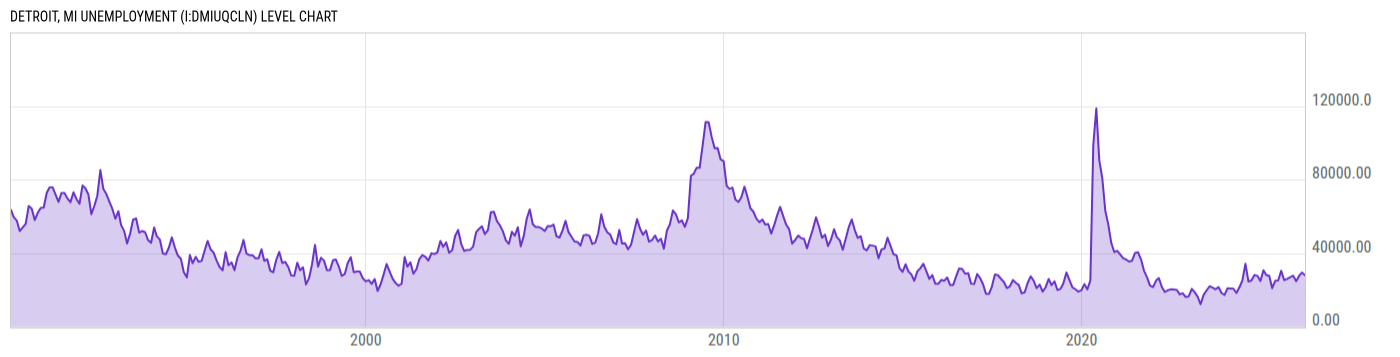
Detroit, MI Unemployment (I:DMIUQCLN)
27906.00 for Mar 2026
Level Chart
Basic Info
|
Detroit, MI Unemployment is at a current level of 27906.00, down from 29343.00 last month and up from 27604.00 one year ago. This is a change of -4.90% from last month and 1.09% from one year ago. |
| Report | Metropolitan Area Employment and Unemployment |
| Categories | Employment , Hours and Wages |
| Region | N/A |
| Source | Bureau of Labor Statistics |
Stats
| Last Value | 27906.00 |
| Latest Period | Mar 2026 |
| Last Updated | May 22 2026, 18:34 EDT |
| Next Release | Jun 3 2026, 10:00 EDT |
| Average Growth Rate | 10.99% |
| Value from Last Month | 29343.00 |
| Change from Last Month | -4.90% |
| Value from 1 Year Ago | 27604.00 |
| Change from 1 Year Ago | 1.09% |
| Frequency | Monthly |
| Adjustment | Not Seasonally Adjusted |
| Download Source File |
Historical Data
| Date | Value |
|---|---|
| March 31, 2026 | 27906.00 |
| February 28, 2026 | 29343.00 |
| January 31, 2026 | 27652.00 |
| December 31, 2025 | 24670.00 |
| November 30, 2025 | 27647.00 |
| October 31, 2025 | |
| September 30, 2025 | 25973.00 |
| August 31, 2025 | 25196.00 |
| July 31, 2025 | 30333.00 |
| June 30, 2025 | 25032.00 |
| May 31, 2025 | 24890.00 |
| April 30, 2025 | 20848.00 |
| March 31, 2025 | 27604.00 |
| February 28, 2025 | 28009.00 |
| January 31, 2025 | 30604.00 |
| December 31, 2024 | 24797.00 |
| November 30, 2024 | 27566.00 |
| October 31, 2024 | 28044.00 |
| September 30, 2024 | 25059.00 |
| August 31, 2024 | 24477.00 |
| July 31, 2024 | 34121.00 |
| June 30, 2024 | 25136.00 |
| May 31, 2024 | 21315.00 |
| April 30, 2024 | 18220.00 |
| March 31, 2024 | 20539.00 |
| Date | Value |
|---|---|
| February 29, 2024 | 20742.00 |
| January 31, 2024 | 20852.00 |
| December 31, 2023 | 17197.00 |
| November 30, 2023 | 18227.00 |
| October 31, 2023 | 21430.00 |
| September 30, 2023 | 20240.00 |
| August 31, 2023 | 21197.00 |
| July 31, 2023 | 21905.00 |
| June 30, 2023 | 19560.00 |
| May 31, 2023 | 17229.00 |
| April 30, 2023 | 12104.00 |
| March 31, 2023 | 16240.00 |
| February 28, 2023 | 18677.00 |
| January 31, 2023 | 20469.00 |
| December 31, 2022 | 16477.00 |
| November 30, 2022 | 16000.00 |
| October 31, 2022 | 18076.00 |
| September 30, 2022 | 17488.00 |
| August 31, 2022 | 19883.00 |
| July 31, 2022 | 20105.00 |
| June 30, 2022 | 20209.00 |
| May 31, 2022 | 19708.00 |
| April 30, 2022 | 18805.00 |
| March 31, 2022 | 21515.00 |
| February 28, 2022 | 26339.00 |
News
Headline
Time (ET)
05/29 08:15
Basic Info
|
Detroit, MI Unemployment is at a current level of 27906.00, down from 29343.00 last month and up from 27604.00 one year ago. This is a change of -4.90% from last month and 1.09% from one year ago. |
| Report | Metropolitan Area Employment and Unemployment |
| Categories | Employment , Hours and Wages |
| Region | N/A |
| Source | Bureau of Labor Statistics |
Stats
| Last Value | 27906.00 |
| Latest Period | Mar 2026 |
| Last Updated | May 22 2026, 18:34 EDT |
| Next Release | Jun 3 2026, 10:00 EDT |
| Average Growth Rate | 10.99% |
| Value from Last Month | 29343.00 |
| Change from Last Month | -4.90% |
| Value from 1 Year Ago | 27604.00 |
| Change from 1 Year Ago | 1.09% |
| Frequency | Monthly |
| Adjustment | Not Seasonally Adjusted |
| Download Source File |