

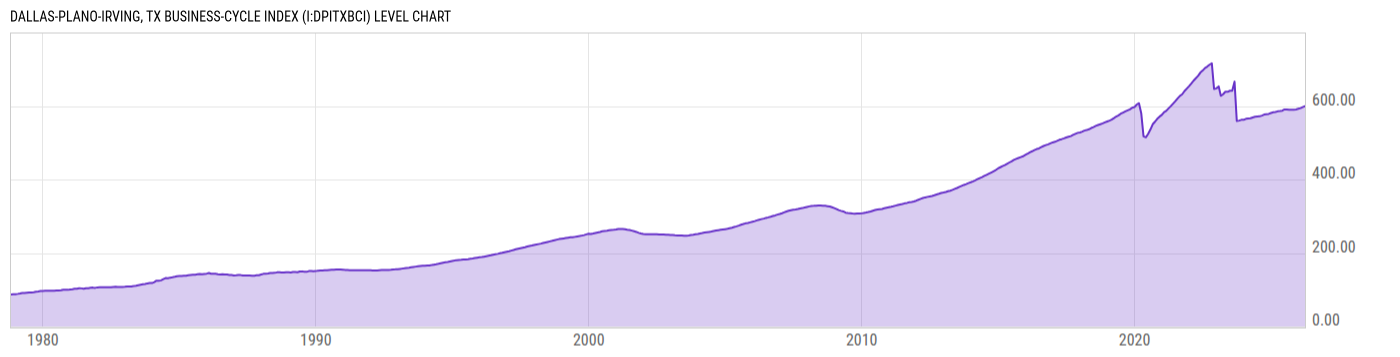
Dallas-Plano-Irving, TX Business-Cycle Index (I:DPITXBCI)
599.56 for Mar 2026
Level Chart
Basic Info
|
Dallas-Plano-Irving, TX Business-Cycle Index is at a current level of 599.56, up from 596.92 last month and up from 585.47 one year ago. This is a change of 0.44% from last month and 2.41% from one year ago. |
| Report | Texas Business-Cycle Indexes |
| Category | Economic Sentiment, Outlook and Activity |
| Region | Texas |
| Source | Federal Reserve Bank of Dallas |
Stats
| Last Value | 599.56 |
| Latest Period | Mar 2026 |
| Last Updated | May 22 2026, 10:05 EDT |
| Next Release | Jun 19 2026, 10:00 EDT (E) |
| Average Growth Rate | 4.15% |
| Value from Last Month | 596.92 |
| Change from Last Month | 0.44% |
| Value from 1 Year Ago | 585.47 |
| Change from 1 Year Ago | 2.41% |
| Frequency | Monthly |
| Unit | Index October 1980=100 |
| Adjustment | N/A |
| Download Source File |
Historical Data
| Date | Value |
|---|---|
| March 31, 2026 | 599.56 |
| February 28, 2026 | 596.92 |
| January 31, 2026 | 594.21 |
| December 31, 2025 | 592.48 |
| November 30, 2025 | 590.66 |
| October 31, 2025 | 590.02 |
| September 30, 2025 | 590.05 |
| August 31, 2025 | 589.71 |
| July 31, 2025 | 590.49 |
| June 30, 2025 | 590.64 |
| May 31, 2025 | 587.22 |
| April 30, 2025 | 586.12 |
| March 31, 2025 | 585.47 |
| February 28, 2025 | 583.74 |
| January 31, 2025 | 582.88 |
| December 31, 2024 | 580.97 |
| November 30, 2024 | 578.40 |
| October 31, 2024 | 577.77 |
| September 30, 2024 | 576.59 |
| August 31, 2024 | 573.93 |
| July 31, 2024 | 571.79 |
| June 30, 2024 | 571.45 |
| May 31, 2024 | 570.67 |
| April 30, 2024 | 568.83 |
| March 31, 2024 | 566.54 |
| Date | Value |
|---|---|
| February 29, 2024 | 566.24 |
| January 31, 2024 | 565.18 |
| December 31, 2023 | 562.38 |
| November 30, 2023 | 562.25 |
| October 31, 2023 | 560.20 |
| September 30, 2023 | 559.50 |
| August 31, 2023 | 666.31 |
| July 31, 2023 | 641.28 |
| June 30, 2023 | 641.46 |
| May 31, 2023 | 638.51 |
| April 30, 2023 | 638.74 |
| March 31, 2023 | 631.99 |
| February 28, 2023 | 627.67 |
| January 31, 2023 | 653.35 |
| December 31, 2022 | 647.95 |
| November 30, 2022 | 646.44 |
| October 31, 2022 | 716.27 |
| September 30, 2022 | 712.26 |
| August 31, 2022 | 707.30 |
| July 31, 2022 | 703.20 |
| June 30, 2022 | 696.36 |
| May 31, 2022 | 690.91 |
| April 30, 2022 | 681.91 |
| March 31, 2022 | 675.57 |
| February 28, 2022 | 668.73 |
News
Headline
Time (ET)
05/13 15:57
05/01 16:52
04/30 13:32
04/30 09:10
04/23 08:36
Basic Info
|
Dallas-Plano-Irving, TX Business-Cycle Index is at a current level of 599.56, up from 596.92 last month and up from 585.47 one year ago. This is a change of 0.44% from last month and 2.41% from one year ago. |
| Report | Texas Business-Cycle Indexes |
| Category | Economic Sentiment, Outlook and Activity |
| Region | Texas |
| Source | Federal Reserve Bank of Dallas |
Stats
| Last Value | 599.56 |
| Latest Period | Mar 2026 |
| Last Updated | May 22 2026, 10:05 EDT |
| Next Release | Jun 19 2026, 10:00 EDT (E) |
| Average Growth Rate | 4.15% |
| Value from Last Month | 596.92 |
| Change from Last Month | 0.44% |
| Value from 1 Year Ago | 585.47 |
| Change from 1 Year Ago | 2.41% |
| Frequency | Monthly |
| Unit | Index October 1980=100 |
| Adjustment | N/A |
| Download Source File |