

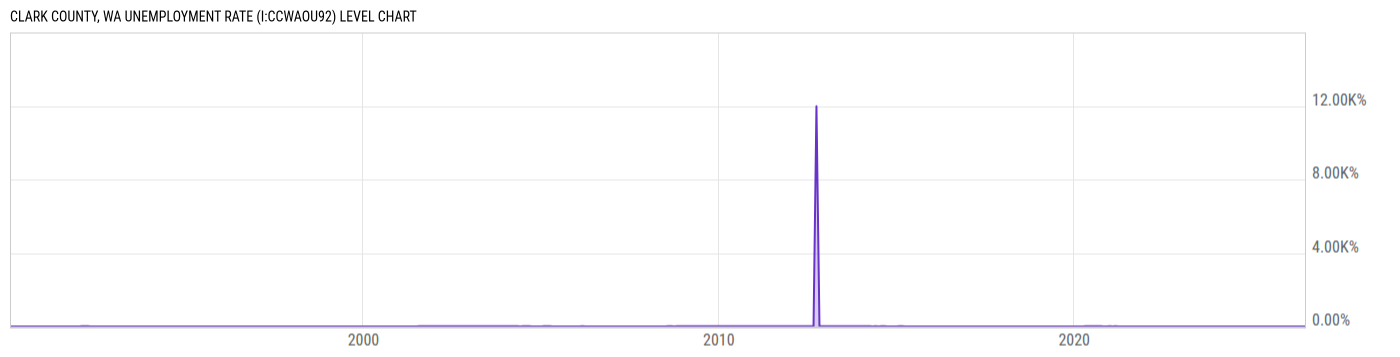
Clark County, WA Unemployment Rate (I:CCWAOU92)
4.40% for Jun 2026
Level Chart
Basic Info
|
Clark County, WA Unemployment Rate is at 4.40%, compared to 4.80% last month and 3.80% last year. This is lower than the long term average of 33.86%. |
| Report | Metropolitan Area Employment and Unemployment |
| Categories | Employment , Hours and Wages |
| Region | N/A |
| Source | Bureau of Labor Statistics |
Stats
| Last Value | 4.40% |
| Latest Period | Jun 2026 |
| Last Updated | Jul 29 2026, 17:35 EDT |
| Next Release | Sep 2 2026, 10:00 EDT |
| Long Term Average | 33.86% |
| Average Growth Rate | 2.98K% |
| Value from Last Month | 4.80% |
| Change from Last Month | -8.33% |
| Value from 1 Year Ago | 3.80% |
| Change from 1 Year Ago | 15.79% |
| Frequency | Monthly |
| Unit | Percent |
| Adjustment | Not Seasonally Adjusted |
| Download Source File |
Historical Data
| Date | Value |
|---|---|
| June 30, 2026 | 4.40% |
| May 31, 2026 | 4.80% |
| April 30, 2026 | 5.10% |
| March 31, 2026 | 5.00% |
| February 28, 2026 | 5.30% |
| January 31, 2026 | 5.00% |
| December 31, 2025 | 5.10% |
| November 30, 2025 | 4.80% |
| October 31, 2025 | |
| September 30, 2025 | 4.10% |
| August 31, 2025 | 4.80% |
| July 31, 2025 | 4.70% |
| June 30, 2025 | 3.80% |
| May 31, 2025 | 4.30% |
| April 30, 2025 | 4.10% |
| March 31, 2025 | 4.50% |
| February 28, 2025 | 5.10% |
| January 31, 2025 | 4.60% |
| December 31, 2024 | 4.40% |
| November 30, 2024 | 4.20% |
| October 31, 2024 | 4.00% |
| September 30, 2024 | 3.70% |
| August 31, 2024 | 4.70% |
| July 31, 2024 | 4.80% |
| June 30, 2024 | 3.70% |
| Date | Value |
|---|---|
| May 31, 2024 | 4.20% |
| April 30, 2024 | 3.80% |
| March 31, 2024 | 4.60% |
| February 29, 2024 | 5.30% |
| January 31, 2024 | 4.70% |
| December 31, 2023 | 4.70% |
| November 30, 2023 | 4.00% |
| October 31, 2023 | 4.20% |
| September 30, 2023 | 3.80% |
| August 31, 2023 | 4.50% |
| July 31, 2023 | 3.80% |
| June 30, 2023 | 2.70% |
| May 31, 2023 | 3.10% |
| April 30, 2023 | 3.30% |
| March 31, 2023 | 4.10% |
| February 28, 2023 | 4.90% |
| January 31, 2023 | 4.30% |
| December 31, 2022 | 4.40% |
| November 30, 2022 | 4.60% |
| October 31, 2022 | 4.20% |
| September 30, 2022 | 4.10% |
| August 31, 2022 | 4.90% |
| July 31, 2022 | 4.20% |
| June 30, 2022 | 4.50% |
| May 31, 2022 | 4.20% |
News
Headline
Time (ET)
07/13 09:06
07/10 08:58
07/02 16:13
Basic Info
|
Clark County, WA Unemployment Rate is at 4.40%, compared to 4.80% last month and 3.80% last year. This is lower than the long term average of 33.86%. |
| Report | Metropolitan Area Employment and Unemployment |
| Categories | Employment , Hours and Wages |
| Region | N/A |
| Source | Bureau of Labor Statistics |
Stats
| Last Value | 4.40% |
| Latest Period | Jun 2026 |
| Last Updated | Jul 29 2026, 17:35 EDT |
| Next Release | Sep 2 2026, 10:00 EDT |
| Long Term Average | 33.86% |
| Average Growth Rate | 2.98K% |
| Value from Last Month | 4.80% |
| Change from Last Month | -8.33% |
| Value from 1 Year Ago | 3.80% |
| Change from 1 Year Ago | 15.79% |
| Frequency | Monthly |
| Unit | Percent |
| Adjustment | Not Seasonally Adjusted |
| Download Source File |