

China Producer Price Index: Consumer Goods (I:CPPICG)
99.00 for Apr 2026
Level Chart
Basic Info
|
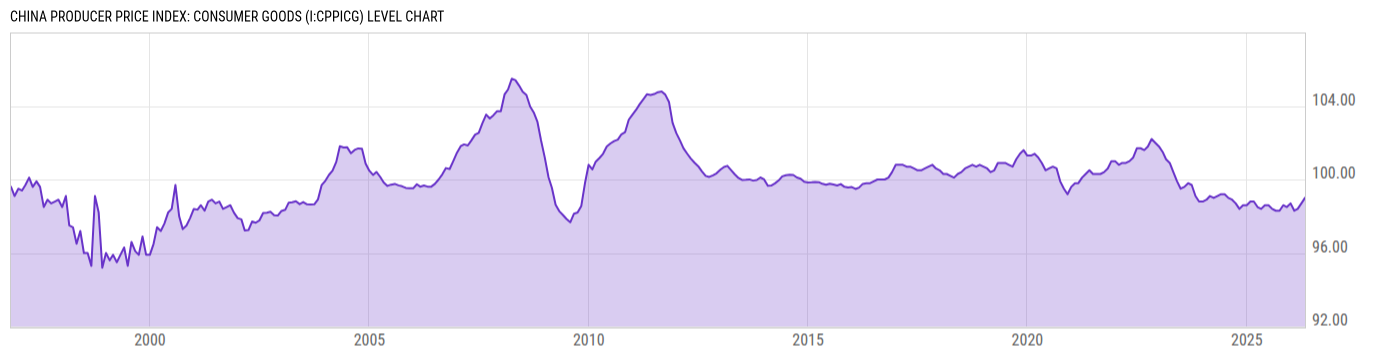
China Producer Price Index: Consumer Goods is at a current level of 99.00, up from 98.70 last month and up from 98.40 one year ago. This is a change of 0.30% from last month and 0.61% from one year ago. |
| Region | China |
| Source | National Bureau of Statistics of China |
Stats
| Last Value | 99.00 |
| Latest Period | Apr 2026 |
| Last Updated | May 11 2026, 09:14 EDT |
| Next Release | Jun 9 2026, 21:30 EDT |
| Average Growth Rate | -0.01% |
| Value from Last Month | 98.70 |
| Change from Last Month | 0.30% |
| Value from 1 Year Ago | 98.40 |
| Change from 1 Year Ago | 0.61% |
| Frequency | Monthly |
| Unit | Index Same Period Last Year=100 |
| Adjustment | Not Seasonally Adjusted |
| Download Source File |
Historical Data
| Date | Value |
|---|---|
| April 30, 2026 | 99.00 |
| March 31, 2026 | 98.70 |
| February 28, 2026 | 98.40 |
| January 31, 2026 | 98.30 |
| December 31, 2025 | 98.70 |
| November 30, 2025 | 98.50 |
| October 31, 2025 | 98.60 |
| September 30, 2025 | 98.30 |
| August 31, 2025 | 98.30 |
| July 31, 2025 | 98.40 |
| June 30, 2025 | 98.60 |
| May 31, 2025 | 98.60 |
| April 30, 2025 | 98.40 |
| March 31, 2025 | 98.50 |
| February 28, 2025 | 98.80 |
| January 31, 2025 | 98.80 |
| December 31, 2024 | 98.60 |
| November 30, 2024 | 98.60 |
| October 31, 2024 | 98.40 |
| September 30, 2024 | 98.70 |
| August 31, 2024 | 98.90 |
| July 31, 2024 | 99.00 |
| June 30, 2024 | 99.20 |
| May 31, 2024 | 99.20 |
| April 30, 2024 | 99.10 |
| Date | Value |
|---|---|
| March 31, 2024 | 99.00 |
| February 29, 2024 | 99.10 |
| January 31, 2024 | 98.90 |
| December 31, 2023 | 98.80 |
| November 30, 2023 | 98.80 |
| October 31, 2023 | 99.10 |
| September 30, 2023 | 99.70 |
| August 31, 2023 | 99.80 |
| July 31, 2023 | 99.60 |
| June 30, 2023 | 99.50 |
| May 31, 2023 | 99.90 |
| April 30, 2023 | 100.40 |
| March 31, 2023 | 100.90 |
| February 28, 2023 | 101.10 |
| January 31, 2023 | 101.50 |
| December 31, 2022 | 101.80 |
| November 30, 2022 | 102.00 |
| October 31, 2022 | 102.20 |
| September 30, 2022 | 101.80 |
| August 31, 2022 | 101.60 |
| July 31, 2022 | 101.70 |
| June 30, 2022 | 101.70 |
| May 31, 2022 | 101.20 |
| April 30, 2022 | 101.00 |
| March 31, 2022 | 100.90 |
News
Headline
Time (ET)
05/13 15:57
05/01 12:49
04/23 07:31
Basic Info
|
China Producer Price Index: Consumer Goods is at a current level of 99.00, up from 98.70 last month and up from 98.40 one year ago. This is a change of 0.30% from last month and 0.61% from one year ago. |
| Region | China |
| Source | National Bureau of Statistics of China |
Stats
| Last Value | 99.00 |
| Latest Period | Apr 2026 |
| Last Updated | May 11 2026, 09:14 EDT |
| Next Release | Jun 9 2026, 21:30 EDT |
| Average Growth Rate | -0.01% |
| Value from Last Month | 98.70 |
| Change from Last Month | 0.30% |
| Value from 1 Year Ago | 98.40 |
| Change from 1 Year Ago | 0.61% |
| Frequency | Monthly |
| Unit | Index Same Period Last Year=100 |
| Adjustment | Not Seasonally Adjusted |
| Download Source File |