

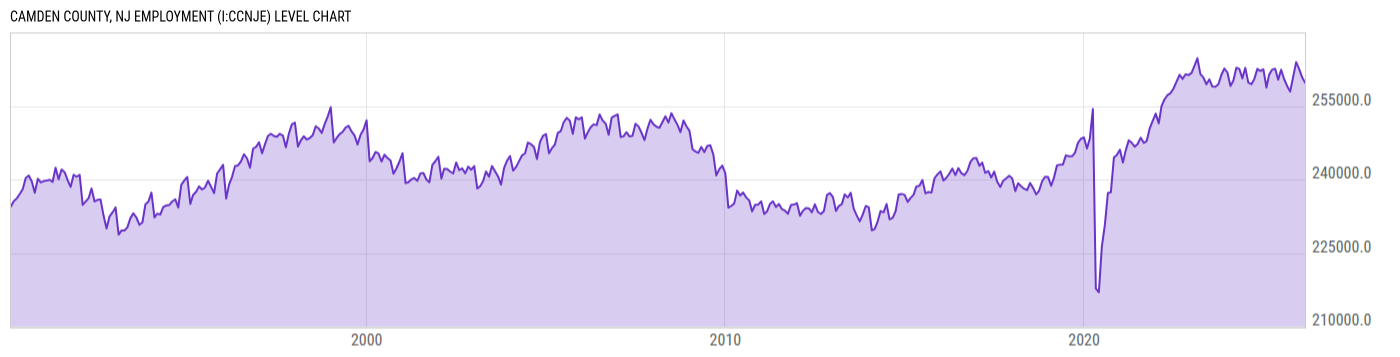
Camden County, NJ Employment (I:CCNJE)
259790.0 for Feb 2026
Level Chart
Basic Info
|
Camden County, NJ Employment is at a current level of 259790.0, down from 260809.0 last month and down from 261402.0 one year ago. This is a change of -0.39% from last month and -0.62% from one year ago. |
| Report | Metropolitan Area Employment and Unemployment |
| Categories | Employment , Hours and Wages |
| Region | N/A |
| Source | Bureau of Labor Statistics |
Stats
| Last Value | 259790.0 |
| Latest Period | Feb 2026 |
| Last Updated | May 2 2026, 18:22 EDT |
| Next Release | May 19 2026, 10:00 EDT |
| Average Growth Rate | 0.29% |
| Value from Last Month | 260809.0 |
| Change from Last Month | -0.39% |
| Value from 1 Year Ago | 261402.0 |
| Change from 1 Year Ago | -0.62% |
| Frequency | Monthly |
| Adjustment | Not Seasonally Adjusted |
| Download Source File |
Historical Data
| Date | Value |
|---|---|
| February 28, 2026 | 259790.0 |
| January 31, 2026 | 260809.0 |
| December 31, 2025 | 262514.0 |
| November 30, 2025 | 263954.0 |
| October 31, 2025 | |
| September 30, 2025 | 257964.0 |
| August 31, 2025 | 259039.0 |
| July 31, 2025 | 260458.0 |
| June 30, 2025 | 262400.0 |
| May 31, 2025 | 260378.0 |
| April 30, 2025 | 262613.0 |
| March 31, 2025 | 262429.0 |
| February 28, 2025 | 261402.0 |
| January 31, 2025 | 258791.0 |
| December 31, 2024 | 262512.0 |
| November 30, 2024 | 262131.0 |
| October 31, 2024 | 262572.0 |
| September 30, 2024 | 260528.0 |
| August 31, 2024 | 259460.0 |
| July 31, 2024 | 259771.0 |
| June 30, 2024 | 262779.0 |
| May 31, 2024 | 260635.0 |
| April 30, 2024 | 262568.0 |
| March 31, 2024 | 262799.0 |
| February 29, 2024 | 260170.0 |
| Date | Value |
|---|---|
| January 31, 2024 | 259098.0 |
| December 31, 2023 | 261838.0 |
| November 30, 2023 | 262652.0 |
| October 31, 2023 | 261381.0 |
| September 30, 2023 | 259440.0 |
| August 31, 2023 | 258928.0 |
| July 31, 2023 | 258963.0 |
| June 30, 2023 | 260428.0 |
| May 31, 2023 | 259440.0 |
| April 30, 2023 | 260843.0 |
| March 31, 2023 | 261506.0 |
| February 28, 2023 | 264746.0 |
| January 31, 2023 | 263274.0 |
| December 31, 2022 | 261768.0 |
| November 30, 2022 | 261297.0 |
| October 31, 2022 | 261489.0 |
| September 30, 2022 | 260545.0 |
| August 31, 2022 | 261377.0 |
| July 31, 2022 | 259964.0 |
| June 30, 2022 | 258573.0 |
| May 31, 2022 | 257635.0 |
| April 30, 2022 | 257214.0 |
| March 31, 2022 | 256380.0 |
| February 28, 2022 | 254981.0 |
| January 31, 2022 | 251463.0 |
News
Headline
Time (ET)
04/23 12:07
04/13 12:03
Basic Info
|
Camden County, NJ Employment is at a current level of 259790.0, down from 260809.0 last month and down from 261402.0 one year ago. This is a change of -0.39% from last month and -0.62% from one year ago. |
| Report | Metropolitan Area Employment and Unemployment |
| Categories | Employment , Hours and Wages |
| Region | N/A |
| Source | Bureau of Labor Statistics |
Stats
| Last Value | 259790.0 |
| Latest Period | Feb 2026 |
| Last Updated | May 2 2026, 18:22 EDT |
| Next Release | May 19 2026, 10:00 EDT |
| Average Growth Rate | 0.29% |
| Value from Last Month | 260809.0 |
| Change from Last Month | -0.39% |
| Value from 1 Year Ago | 261402.0 |
| Change from 1 Year Ago | -0.62% |
| Frequency | Monthly |
| Adjustment | Not Seasonally Adjusted |
| Download Source File |