

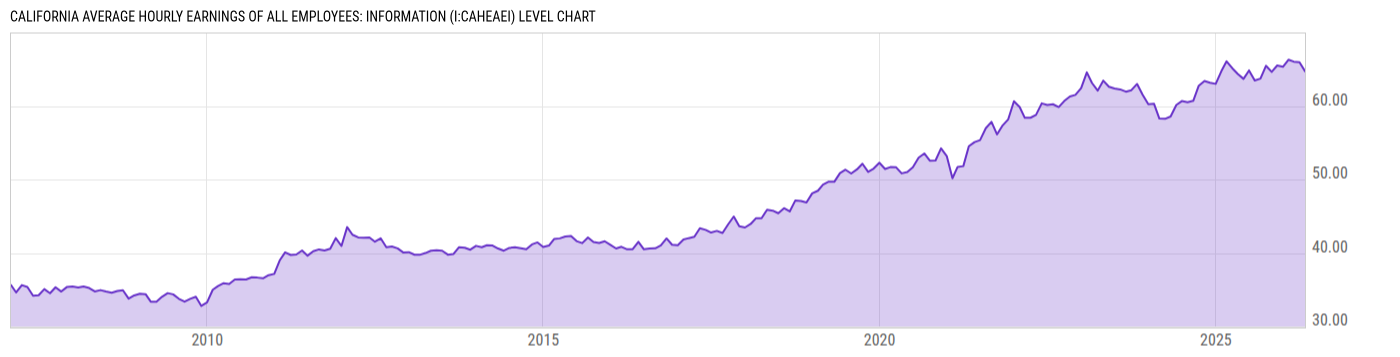
California Average Hourly Earnings of All Employees: Information (I:CAHEAEI)
65.88 USD for Mar 2026
Level Chart
Basic Info
|
California Average Hourly Earnings of All Employees: Information is at a current level of 65.88, down from 66.03 last month and up from 65.14 one year ago. This is a change of -0.23% from last month and 1.14% from one year ago. |
| Report | Regional and State Employment and Unemployment |
| Categories | Employment , Hours and Wages |
| Region | California |
| Source | Bureau of Labor Statistics |
Stats
| Last Value | 65.88 |
| Latest Period | Mar 2026 |
| Last Updated | May 6 2026, 11:16 EDT |
| Next Release | May 22 2026, 10:30 EDT |
| Average Growth Rate | 3.38% |
| Value from Last Month | 66.03 |
| Change from Last Month | -0.23% |
| Value from 1 Year Ago | 65.14 |
| Change from 1 Year Ago | 1.14% |
| Frequency | Monthly |
| Unit | USD |
| Adjustment | Not Seasonally Adjusted |
| Download Source File | |
| Notes | In Dollars. |
Historical Data
| Date | Value |
|---|---|
| March 31, 2026 | 65.88 |
| February 28, 2026 | 66.03 |
| January 31, 2026 | 66.30 |
| December 31, 2025 | 65.33 |
| November 30, 2025 | 65.51 |
| October 31, 2025 | 64.64 |
| September 30, 2025 | 65.47 |
| August 31, 2025 | 63.73 |
| July 31, 2025 | 63.47 |
| June 30, 2025 | 64.84 |
| May 31, 2025 | 63.69 |
| April 30, 2025 | 64.36 |
| March 31, 2025 | 65.14 |
| February 28, 2025 | 66.08 |
| January 31, 2025 | 64.75 |
| December 31, 2024 | 63.01 |
| November 30, 2024 | 63.17 |
| October 31, 2024 | 63.41 |
| September 30, 2024 | 62.76 |
| August 31, 2024 | 60.71 |
| July 31, 2024 | 60.52 |
| June 30, 2024 | 60.67 |
| May 31, 2024 | 60.13 |
| April 30, 2024 | 58.57 |
| March 31, 2024 | 58.25 |
| Date | Value |
|---|---|
| February 29, 2024 | 58.29 |
| January 31, 2024 | 60.29 |
| December 31, 2023 | 60.24 |
| November 30, 2023 | 61.54 |
| October 31, 2023 | 63.00 |
| September 30, 2023 | 62.15 |
| August 31, 2023 | 61.95 |
| July 31, 2023 | 62.26 |
| June 30, 2023 | 62.38 |
| May 31, 2023 | 62.62 |
| April 30, 2023 | 63.45 |
| March 31, 2023 | 62.09 |
| February 28, 2023 | 63.13 |
| January 31, 2023 | 64.58 |
| December 31, 2022 | 62.42 |
| November 30, 2022 | 61.51 |
| October 31, 2022 | 61.29 |
| September 30, 2022 | 60.67 |
| August 31, 2022 | 59.85 |
| July 31, 2022 | 60.24 |
| June 30, 2022 | 60.14 |
| May 31, 2022 | 60.36 |
| April 30, 2022 | 58.79 |
| March 31, 2022 | 58.40 |
| February 28, 2022 | 58.39 |
News
Headline
Time (ET)
Basic Info
|
California Average Hourly Earnings of All Employees: Information is at a current level of 65.88, down from 66.03 last month and up from 65.14 one year ago. This is a change of -0.23% from last month and 1.14% from one year ago. |
| Report | Regional and State Employment and Unemployment |
| Categories | Employment , Hours and Wages |
| Region | California |
| Source | Bureau of Labor Statistics |
Stats
| Last Value | 65.88 |
| Latest Period | Mar 2026 |
| Last Updated | May 6 2026, 11:16 EDT |
| Next Release | May 22 2026, 10:30 EDT |
| Average Growth Rate | 3.38% |
| Value from Last Month | 66.03 |
| Change from Last Month | -0.23% |
| Value from 1 Year Ago | 65.14 |
| Change from 1 Year Ago | 1.14% |
| Frequency | Monthly |
| Unit | USD |
| Adjustment | Not Seasonally Adjusted |
| Download Source File | |
| Notes | In Dollars. |