

Caldwell, ID Employment (I:CIDE)
33827.00 for Feb 2026
Level Chart
Basic Info
|
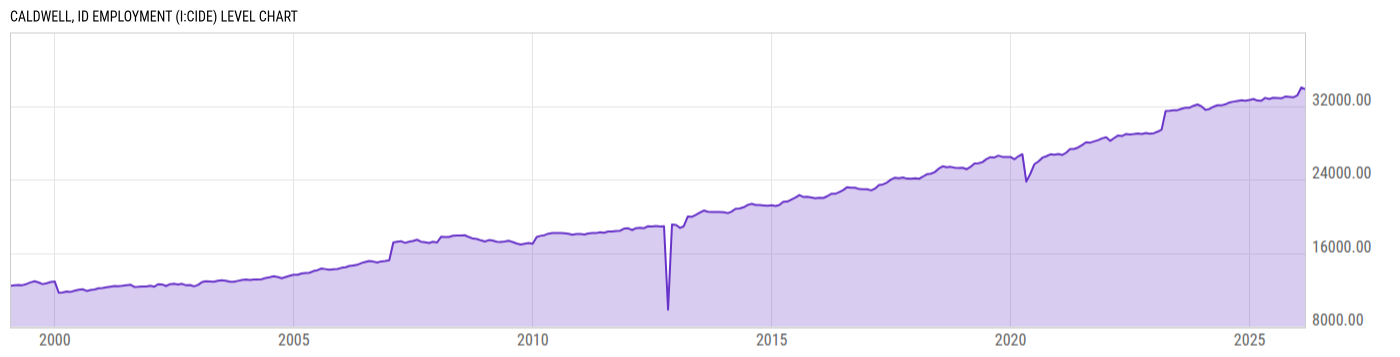
Caldwell, ID Employment is at a current level of 33827.00, down from 34017.00 last month and up from 32588.00 one year ago. This is a change of -0.56% from last month and 3.80% from one year ago. |
| Report | Metropolitan Area Employment and Unemployment |
| Categories | Employment , Hours and Wages |
| Region | N/A |
| Source | Bureau of Labor Statistics |
Stats
| Last Value | 33827.00 |
| Latest Period | Feb 2026 |
| Last Updated | May 2 2026, 18:22 EDT |
| Next Release | May 19 2026, 10:00 EDT |
| Average Growth Rate | 5.54% |
| Value from Last Month | 34017.00 |
| Change from Last Month | -0.56% |
| Value from 1 Year Ago | 32588.00 |
| Change from 1 Year Ago | 3.80% |
| Frequency | Monthly |
| Adjustment | Not Seasonally Adjusted |
| Download Source File |
Historical Data
| Date | Value |
|---|---|
| February 28, 2026 | 33827.00 |
| January 31, 2026 | 34017.00 |
| December 31, 2025 | 33149.00 |
| November 30, 2025 | 32942.00 |
| October 31, 2025 | |
| September 30, 2025 | 33030.00 |
| August 31, 2025 | 32834.00 |
| July 31, 2025 | 32881.00 |
| June 30, 2025 | 32893.00 |
| May 31, 2025 | 32757.00 |
| April 30, 2025 | 32882.00 |
| March 31, 2025 | 32572.00 |
| February 28, 2025 | 32588.00 |
| January 31, 2025 | 32758.00 |
| December 31, 2024 | 32657.00 |
| November 30, 2024 | 32561.00 |
| October 31, 2024 | 32623.00 |
| September 30, 2024 | 32556.00 |
| August 31, 2024 | 32478.00 |
| July 31, 2024 | 32389.00 |
| June 30, 2024 | 32184.00 |
| May 31, 2024 | 32069.00 |
| April 30, 2024 | 32085.00 |
| March 31, 2024 | 31925.00 |
| February 29, 2024 | 31679.00 |
| Date | Value |
|---|---|
| January 31, 2024 | 31577.00 |
| December 31, 2023 | 31953.00 |
| November 30, 2023 | 32162.00 |
| October 31, 2023 | 32031.00 |
| September 30, 2023 | 31812.00 |
| August 31, 2023 | 31823.00 |
| July 31, 2023 | 31702.00 |
| June 30, 2023 | 31547.00 |
| May 31, 2023 | 31529.00 |
| April 30, 2023 | 31474.00 |
| March 31, 2023 | 31466.00 |
| February 28, 2023 | 29430.00 |
| January 31, 2023 | 29223.00 |
| December 31, 2022 | 29040.00 |
| November 30, 2022 | 28985.00 |
| October 31, 2022 | 29071.00 |
| September 30, 2022 | 28959.00 |
| August 31, 2022 | 29010.00 |
| July 31, 2022 | 28942.00 |
| June 30, 2022 | 28904.00 |
| May 31, 2022 | 28948.00 |
| April 30, 2022 | 28726.00 |
| March 31, 2022 | 28780.00 |
| February 28, 2022 | 28485.00 |
| January 31, 2022 | 28209.00 |
News
Headline
Time (ET)
04/23 12:07
Basic Info
|
Caldwell, ID Employment is at a current level of 33827.00, down from 34017.00 last month and up from 32588.00 one year ago. This is a change of -0.56% from last month and 3.80% from one year ago. |
| Report | Metropolitan Area Employment and Unemployment |
| Categories | Employment , Hours and Wages |
| Region | N/A |
| Source | Bureau of Labor Statistics |
Stats
| Last Value | 33827.00 |
| Latest Period | Feb 2026 |
| Last Updated | May 2 2026, 18:22 EDT |
| Next Release | May 19 2026, 10:00 EDT |
| Average Growth Rate | 5.54% |
| Value from Last Month | 34017.00 |
| Change from Last Month | -0.56% |
| Value from 1 Year Ago | 32588.00 |
| Change from 1 Year Ago | 3.80% |
| Frequency | Monthly |
| Adjustment | Not Seasonally Adjusted |
| Download Source File |