

Bullhead City, AZ Labor Force (I:BCAZLF)
16212.00 for May 2026
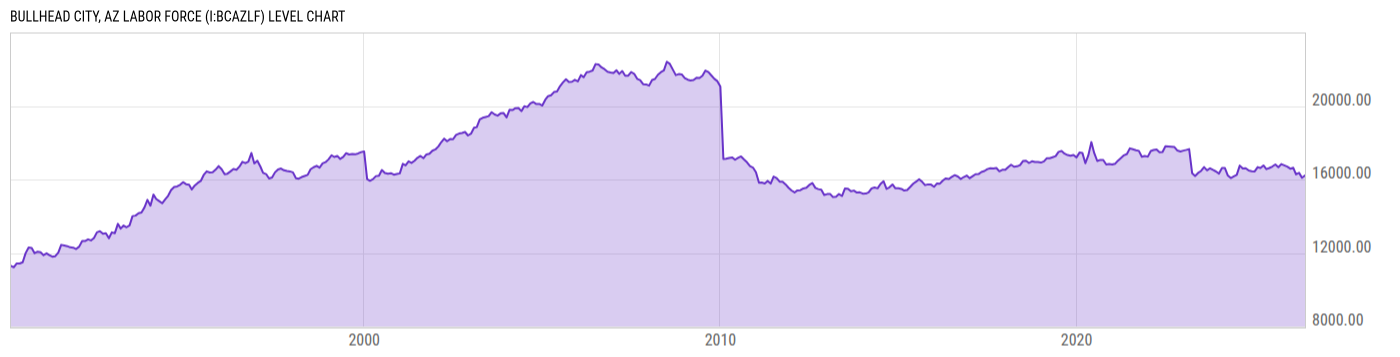
Level Chart
Basic Info
|
Bullhead City, AZ Labor Force is at a current level of 16212.00, up from 16093.00 last month and down from 16626.00 one year ago. This is a change of 0.74% from last month and -2.49% from one year ago. |
| Report | Metropolitan Area Employment and Unemployment |
| Categories | Employment , Hours and Wages |
| Region | N/A |
| Source | Bureau of Labor Statistics |
Stats
| Last Value | 16212.00 |
| Latest Period | May 2026 |
| Last Updated | Jul 1 2026, 16:30 EDT |
| Next Release | Jul 29 2026, 10:00 EDT |
| Average Growth Rate | 1.17% |
| Value from Last Month | 16093.00 |
| Change from Last Month | 0.74% |
| Value from 1 Year Ago | 16626.00 |
| Change from 1 Year Ago | -2.49% |
| Frequency | Monthly |
| Adjustment | Not Seasonally Adjusted |
| Download Source File |
Historical Data
| Date | Value |
|---|---|
| May 31, 2026 | 16212.00 |
| April 30, 2026 | 16093.00 |
| March 31, 2026 | 16361.00 |
| February 28, 2026 | 16276.00 |
| January 31, 2026 | 16635.00 |
| December 31, 2025 | 16589.00 |
| November 30, 2025 | 16699.00 |
| October 31, 2025 | |
| September 30, 2025 | 16837.00 |
| August 31, 2025 | 16669.00 |
| July 31, 2025 | 16819.00 |
| June 30, 2025 | 16706.00 |
| May 31, 2025 | 16626.00 |
| April 30, 2025 | 16562.00 |
| March 31, 2025 | 16764.00 |
| February 28, 2025 | 16627.00 |
| January 31, 2025 | 16674.00 |
| December 31, 2024 | 16440.00 |
| November 30, 2024 | 16450.00 |
| October 31, 2024 | 16486.00 |
| September 30, 2024 | 16617.00 |
| August 31, 2024 | 16594.00 |
| July 31, 2024 | 16757.00 |
| June 30, 2024 | 16249.00 |
| May 31, 2024 | 16167.00 |
| Date | Value |
|---|---|
| April 30, 2024 | 16080.00 |
| March 31, 2024 | 16215.00 |
| February 29, 2024 | 16631.00 |
| January 31, 2024 | 16629.00 |
| December 31, 2023 | 16322.00 |
| November 30, 2023 | 16435.00 |
| October 31, 2023 | 16518.00 |
| September 30, 2023 | 16611.00 |
| August 31, 2023 | 16500.00 |
| July 31, 2023 | 16675.00 |
| June 30, 2023 | 16465.00 |
| May 31, 2023 | 16357.00 |
| April 30, 2023 | 16191.00 |
| March 31, 2023 | 16335.00 |
| February 28, 2023 | 17655.00 |
| January 31, 2023 | 17611.00 |
| December 31, 2022 | 17572.00 |
| November 30, 2022 | 17526.00 |
| October 31, 2022 | 17576.00 |
| September 30, 2022 | 17764.00 |
| August 31, 2022 | 17781.00 |
| July 31, 2022 | 17795.00 |
| June 30, 2022 | 17810.00 |
| May 31, 2022 | 17495.00 |
| April 30, 2022 | 17488.00 |
News
Headline
Time (ET)
07/13 09:06
07/10 08:58
07/02 16:13
Basic Info
|
Bullhead City, AZ Labor Force is at a current level of 16212.00, up from 16093.00 last month and down from 16626.00 one year ago. This is a change of 0.74% from last month and -2.49% from one year ago. |
| Report | Metropolitan Area Employment and Unemployment |
| Categories | Employment , Hours and Wages |
| Region | N/A |
| Source | Bureau of Labor Statistics |
Stats
| Last Value | 16212.00 |
| Latest Period | May 2026 |
| Last Updated | Jul 1 2026, 16:30 EDT |
| Next Release | Jul 29 2026, 10:00 EDT |
| Average Growth Rate | 1.17% |
| Value from Last Month | 16093.00 |
| Change from Last Month | 0.74% |
| Value from 1 Year Ago | 16626.00 |
| Change from 1 Year Ago | -2.49% |
| Frequency | Monthly |
| Adjustment | Not Seasonally Adjusted |
| Download Source File |