

Brent Crude Oil Spot Price (I:BCOSPNK)
Level Chart
Basic Info
|
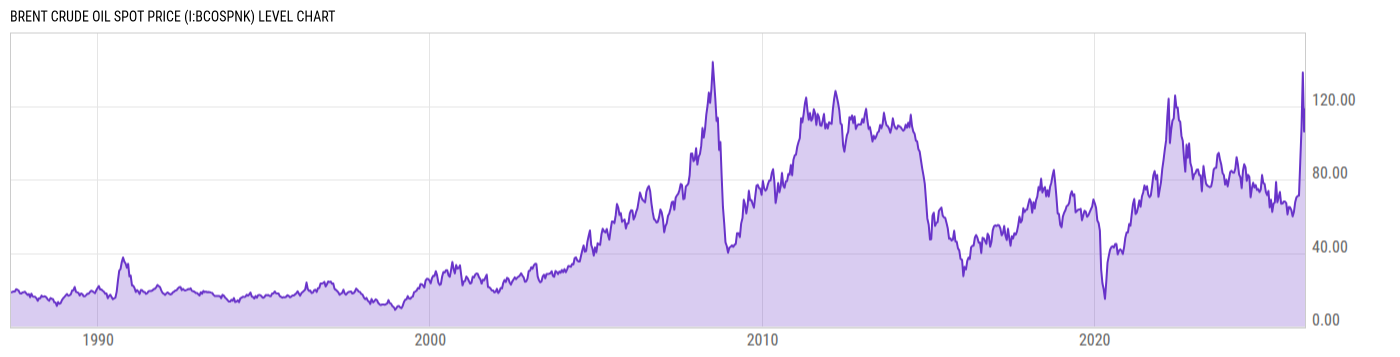
Brent Crude Oil Spot Price is at a current level of 106.11, up from 103.48 the previous market day and up from 64.26 one year ago. This is a change of 2.54% from the previous market day and 65.13% from one year ago. |
|
Brent Crude Oil Spot Price is one of the major benchmarks used in pricing oil, alongside WTI Crude Oil Spot Price. Both Brent Crude and WTI Crude oil prices tend to be highly correlated. Brent Crude Oil is sourced from the North Sea and originally came from the Brent oil field. Brent in particular is useful for pricing any oil produce in the Atlantic Basin. One of the most notable times for the Brent Crude Oil Spot Price was in 2008. Prices for Brent Crude reached as high as $143.95/barrel because of large cuts in production. However, because of the financial crisis and an abrupt loss of demand for oil globally, the price of Brent Crude fell as much at 70% off highs in January of 2009. |
| Report | Weekly Petroleum Status |
| Category | Energy |
| Region | N/A |
| Source | Energy Information Administration |
Stats
| Last Value | 106.11 |
| Latest Period | May 11 2026 |
| Last Updated | May 13 2026, 12:01 EDT |
| Next Release | May 20 2026, 12:00 EDT |
| Average Growth Rate | 12.46% |
| Value from The Previous Market Day | 103.48 |
| Change from The Previous Market Day | 2.54% |
| Value from 1 Year Ago | 64.26 |
| Change from 1 Year Ago | 65.13% |
| Frequency | Market Daily |
| Unit | USD per Barrel |
| Adjustment | N/A |
| Download Source File | |
| Notes | Europe spot price, FOB, U.S. dollars per barrel. |
Historical Data
| Date | Value |
|---|---|
| May 11, 2026 | 106.11 |
| May 08, 2026 | 103.48 |
| May 07, 2026 | 101.82 |
| May 06, 2026 | 103.70 |
| May 05, 2026 | 114.51 |
| May 01, 2026 | 118.26 |
| April 30, 2026 | 124.24 |
| April 29, 2026 | 124.16 |
| April 28, 2026 | 117.62 |
| April 27, 2026 | 113.89 |
| April 24, 2026 | 111.86 |
| April 23, 2026 | 113.25 |
| April 22, 2026 | 113.44 |
| April 21, 2026 | 106.14 |
| April 20, 2026 | 103.40 |
| April 17, 2026 | 98.63 |
| April 16, 2026 | 116.63 |
| April 15, 2026 | 114.93 |
| April 14, 2026 | 118.69 |
| April 13, 2026 | 123.28 |
| April 10, 2026 | 119.07 |
| April 09, 2026 | 119.03 |
| April 08, 2026 | 122.11 |
| April 07, 2026 | 138.21 |
| April 02, 2026 | 127.61 |
| Date | Value |
|---|---|
| April 01, 2026 | 119.56 |
| March 31, 2026 | 126.69 |
| March 30, 2026 | 121.88 |
| March 27, 2026 | 121.47 |
| March 26, 2026 | 113.39 |
| March 25, 2026 | 109.14 |
| March 24, 2026 | 108.42 |
| March 23, 2026 | 103.79 |
| March 20, 2026 | 118.42 |
| March 19, 2026 | 111.05 |
| March 18, 2026 | 118.09 |
| March 17, 2026 | 108.39 |
| March 16, 2026 | 101.04 |
| March 13, 2026 | 103.23 |
| March 12, 2026 | 102.38 |
| March 11, 2026 | 90.98 |
| March 10, 2026 | 89.84 |
| March 09, 2026 | 94.35 |
| March 06, 2026 | 95.74 |
| March 05, 2026 | 88.59 |
| March 04, 2026 | 81.56 |
| March 03, 2026 | 83.28 |
| March 02, 2026 | 77.24 |
| February 27, 2026 | 71.32 |
| February 26, 2026 | 71.66 |
News
Basic Info
|
Brent Crude Oil Spot Price is at a current level of 106.11, up from 103.48 the previous market day and up from 64.26 one year ago. This is a change of 2.54% from the previous market day and 65.13% from one year ago. |
|
Brent Crude Oil Spot Price is one of the major benchmarks used in pricing oil, alongside WTI Crude Oil Spot Price. Both Brent Crude and WTI Crude oil prices tend to be highly correlated. Brent Crude Oil is sourced from the North Sea and originally came from the Brent oil field. Brent in particular is useful for pricing any oil produce in the Atlantic Basin. One of the most notable times for the Brent Crude Oil Spot Price was in 2008. Prices for Brent Crude reached as high as $143.95/barrel because of large cuts in production. However, because of the financial crisis and an abrupt loss of demand for oil globally, the price of Brent Crude fell as much at 70% off highs in January of 2009. |
| Report | Weekly Petroleum Status |
| Category | Energy |
| Region | N/A |
| Source | Energy Information Administration |
Stats
| Last Value | 106.11 |
| Latest Period | May 11 2026 |
| Last Updated | May 13 2026, 12:01 EDT |
| Next Release | May 20 2026, 12:00 EDT |
| Average Growth Rate | 12.46% |
| Value from The Previous Market Day | 103.48 |
| Change from The Previous Market Day | 2.54% |
| Value from 1 Year Ago | 64.26 |
| Change from 1 Year Ago | 65.13% |
| Frequency | Market Daily |
| Unit | USD per Barrel |
| Adjustment | N/A |
| Download Source File | |
| Notes | Europe spot price, FOB, U.S. dollars per barrel. |
Related Indicators
| World Energy |
| Australia Coal Price | 130.92 USD/mt |
| Average Crude Oil Spot Price | 103.91 USD/bbl |
| Brent WTI Spread | 4.55 USD/bbl |
| Dubai Fateh Crude Oil Spot Price | 126.71 USD/bbl |
| Japan Liquefied Natural Gas Import Price | 11.67 USD/MMBtu |
| OPEC Crude Oil Production | 30.93M bbl/d |
| US Liquefied Natural Gas Exports Price | 11.33 USD/thou cf |
| World Oil Consumption | 101.42M bbl/d |
| World Oil Production | 96.89M bbl/d |
| World Oil Rig Count | 713.00 |
| WTI Crude Oil Spot Price | 101.56 USD/bbl |